Fig. 3.

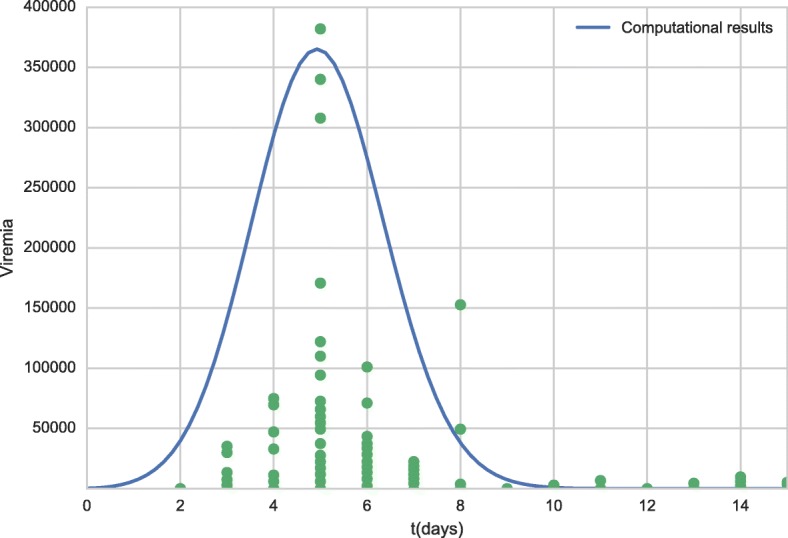
Viremia curve for all period obtained by model (line) and experimental data obtained from the literature [32] (dots). Each dot in time scale represents a distinct patient

Viremia curve for all period obtained by model (line) and experimental data obtained from the literature [32] (dots). Each dot in time scale represents a distinct patient