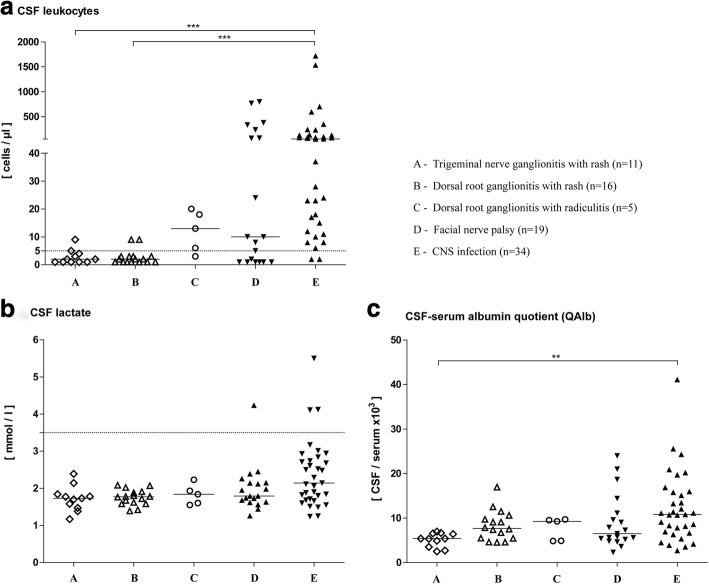
Fig. 4.
Cerebrospinal fluid results in patients with varicella zoster virus reactivation. Graphs show the distribution of cell count (a), lactate (b), and albumin CSF/serum quotients (c). Bars represent median values in each group. Cell count ≥5/μl and lactate ≥3.5 mmol/l were considered elevated. **P < 0.01, ***P < 0.001

