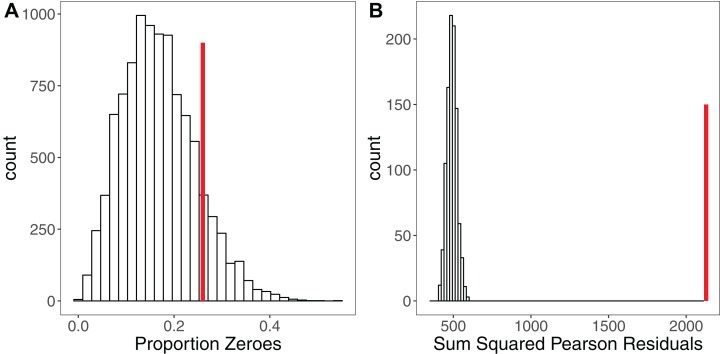
Figure 3. Using Simulation to Assess Model Fit for GLMMs.
(A) Histogram of the proportion of zeroes in 10,000 datasets simulated from a Poisson GLMM. Vertical red line shows the proportion of zeroes in our real dataset. There is no strong evidence of zero-inflation for these data. (B) Histogram of the sum of squared Pearson residuals for 1,000 parametric bootstraps where the Poisson GLMM has been re-fitted to the data at each step. Vertical red line shows the test statistic for the original model, which lies well outside the simulated frequency distribution. The ratio of the real statistic to the simulated data can be used to calculate a mean dispersion statistic and 95% confidence intervals, which for these data is mean 3.16, (95% CI [2.77–3.59]). Simulating from models provides a simple yet powerful set of tools for assessing model fit and robustness.

