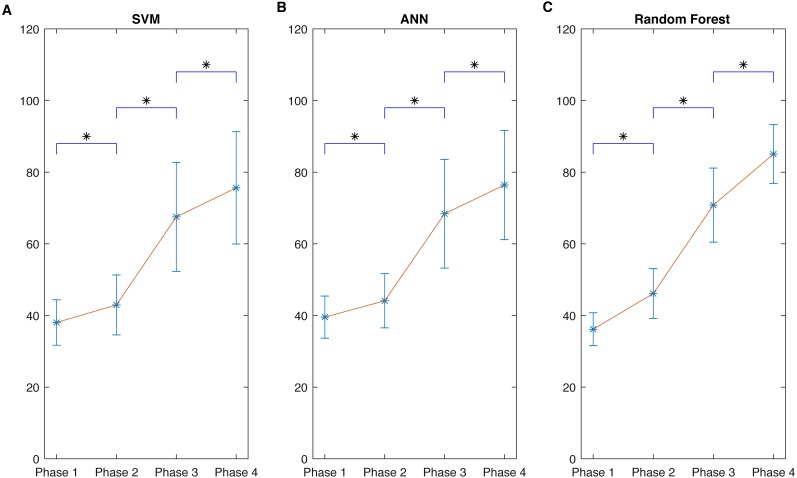
Figure 7. Comparisons of performance of the three different kinds of regression models.
Different BIS phase’ values and corresponding SampEn regression outputs derived from three learning models: (A) SVM; (B) ANN; (C) Random Forest. Even though different phases in each model can be statistically different from each other, the mean gap between every two nearby phases in (C) is much larger and the variation in each phase is much smaller than corresponding phase in SVM (A) and ANN (B). It demonstrates the good fitting ability of Random Forest among these methods. The results are consistent with Tables 4–6. Data are presented as mean ± SD; SampEn values obtained during the different phases were compared by one-way ANOVA on ranks and Student-Newman-Keuls test for pairwise comparisons. The asterisk (*) indicates that SampEn values in each phase are significantly different with P < 0.05 when compared to the values of the preceding phase.

