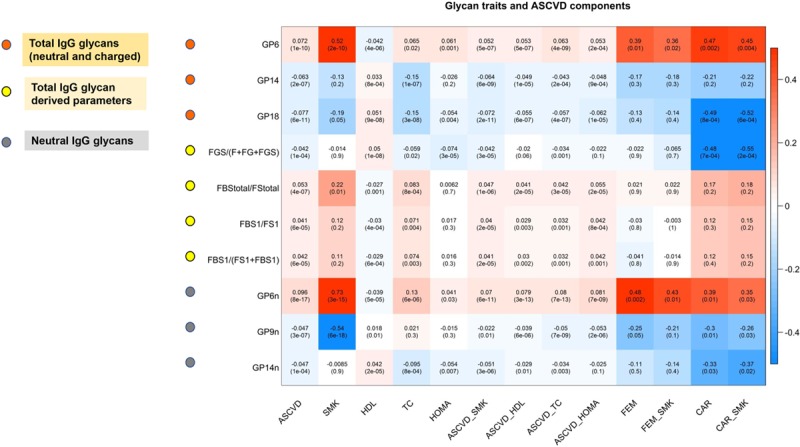
Figure 3.

Glycan traits and atherosclerotic cardiovascular disease (ASCVD) components. Each cell of the matrix contains the regression coefficient between one glycan trait and a component of the 10-y ASCVD risk score and the corresponding P value. The table is color coded by correlation according to the table legend (red for positive and blue for negative correlations). ASCVD indicates 10-y ASCVD risk score; ASCVD_HDL, 10-y ASCVD risk score adjusted for covariates and HDL cholesterol; ASCVD_HOMA, 10-y ASCVD risk score adjusted for covariates and insulin resistance; ASCVD_SMK, 10-y ASCVD risk score adjusted for covariates and smoking; ASCVD_TC, 10-year ASCVD risk score adjusted for covariates and TC; CAR, carotid plaque; CAR_SMK, CAR adjusted for covariates and smoking; FEM, femoral plaque; FEM_SMK, FEM adjusted for covariates and smoking; HDL, high-density lipoprotein; HOMA, homeostasis model assessment insulin resistance; SMK, smoking; and TC, total cholesterol.
