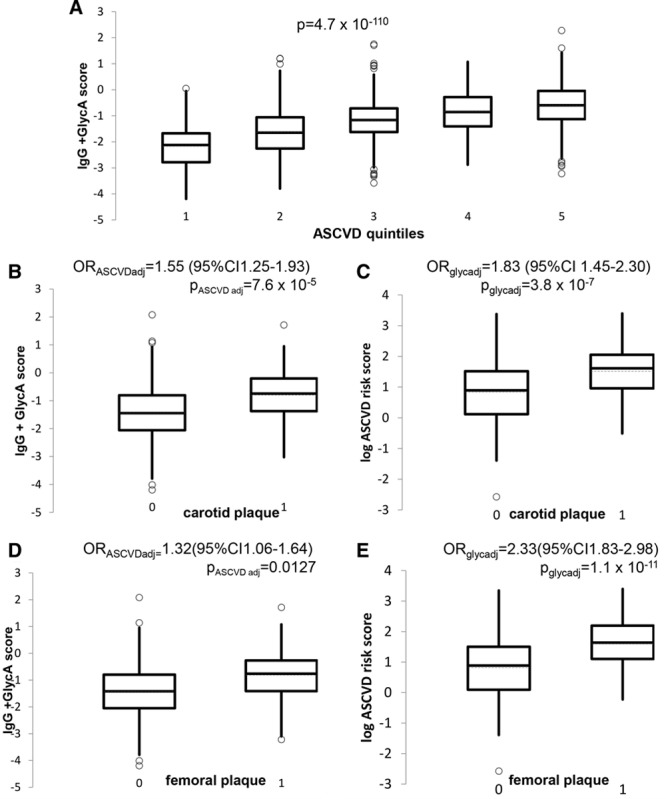
Figure 4.

Combined glycan score vs cardiovascular disease risk and measures of subclinical atherosclerosis. A, Box plot showing the distribution of the glycan score in quintiles of the 10-y atherosclerotic cardiovascular disease (ASCVD) risk score. B, Box plot showing the distribution of the glycan (IgG+GlycA) score in individuals with and without carotid plaque. P values and odds ratios (OR) from logistic regression adjusted for log (10-y ASCVD risk score). C, Box plot showing the distribution of the log (10-y ASCVD risk score) in individuals with and without carotid plaque, OR and P value adjusted for glycan score. D, Box plot showing the distribution of the glycan score in individuals with and without femoral plaque. P value and OR adjusted for log (10-y ASCVD risk score). E, Box plot showing the distribution of the log (10-y ASCVD risk score) in individuals with and without femoral plaque, OR and P value adjusted for glycan score. CI indicates confidence interval.
