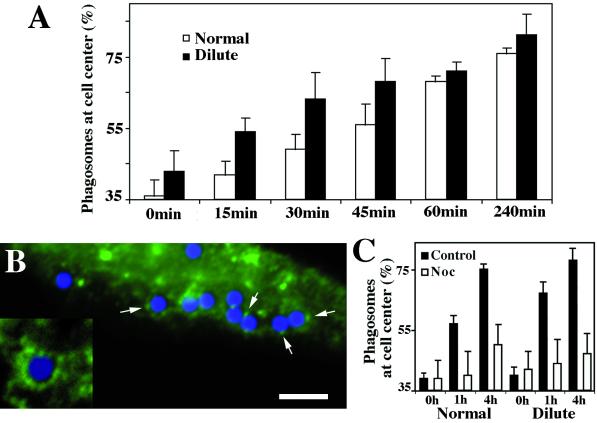
Figure 6.
(A) Time course of phagosome accumulation near the cell center in normal and dilute-lethal macrophages based on three independent experiments. Cells were loaded for 15 min, washed for 15 min (0 time), and then chased for 15, 30, 45, 60, and 240 min. For each time point, 20 cells were analyzed (see MATERIALS AND METHODS). An increased rate of accumulation was found in dilute-lethal macrophages (see time points 15, 30, and 45 min). (B) Immunofluorescence labeling with DIL2 antibody of normal macrophages engaged in phagocytosis. Fluorescent patches were found associated with some phagosomes enclosing blue latex beads in normal macrophages (arrows), but not in dilute-lethal cells (not shown). Bar, 10 μm. (Inset) Twofold-higher magnification. (C) Time course of phagosome accumulation near the cell center in normal (normal) and dilute-lethal (dilute) macrophages in the presence of nocodazole. The cells were treated as in A and chased for 1 h and 4 h in media with 5 μM nocodazole (Noc).

