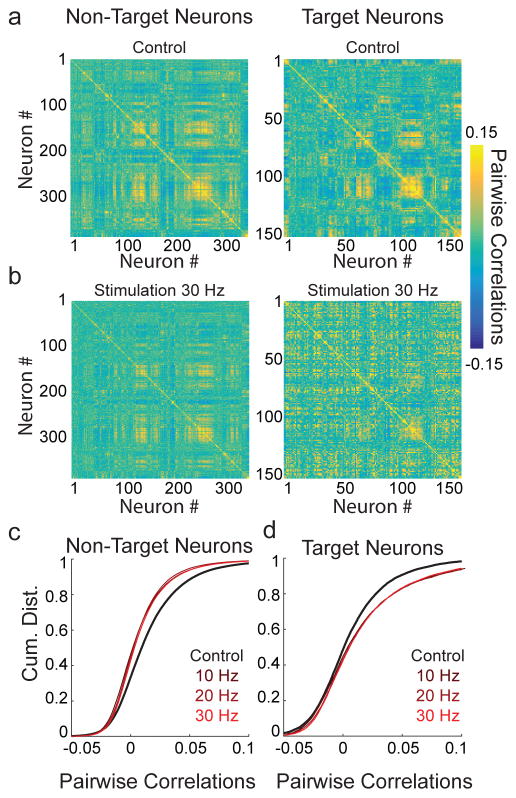
Figure 8. Altering population correlational structure with 2P ensemble stimulation.
a) Left, pairwise Pearson’s correlations for non-targeted neurons calculated based on firing during control trials (n = 365 neurons); right, pairwise correlations of target neurons during control trials (n = 150 neurons).
b) Left, pairwise correlations between non-target neurons or target neurons (right) during trials in which ensembles were stimulated at 30 Hz (10 × 5 ms pulses, see color bar on right).
c) Cumulative distributions of all pairwise correlations between non-target neurons during control trials (black) or during trials on which ensemble stimulation occurred at 10–30 Hz (red shaded). All stimulation conditions decorrelated population activity relative to control trials (p<0.01), but were not significantly different from each other (p>0.425, Friedman test with Tukey-Kramer correction for multiple comparisons). Cumulative distributions are from a representative experiment (Experiment performed in n = 3 mice. Stimulation vs. control trials, non-target cells: Mouse 1: p=0.007, Mouse 2: p=1.3×10⁻⁶, Mouse 3: p=0.004, Friedman test with Tukey-Kramer correction for multiple comparisons).
d) Cumulative distributions of all pairwise correlations between target neurons during control trials (black) or during trials in which ensembles were stimulated at 10–30 Hz (red shaded). All stimulation conditions increased correlations between target neurons relative to control trials (p<0.01), but were not significantly different from each other (p>0.186, Friedman test with Tukey-Kramer correction for multiple comparisons). Cumulative distributions are from a representative experiment (Experiment performed in n = 3 mice. Stimulation vs. control trials, target cells, Mouse 1: p=0.003, Mouse 2: p=5.4×10⁻³, Mouse 3: p=0.02, Friedman test with Tukey-Kramer correction for multiple comparisons).

