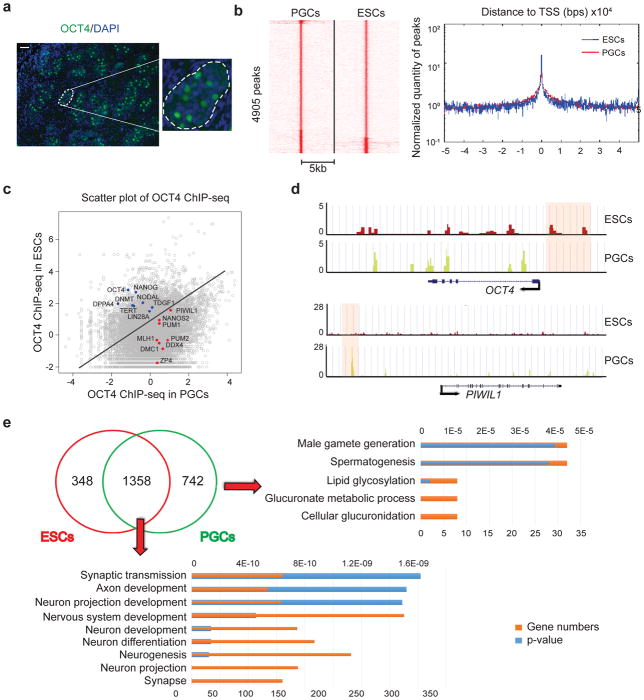
Figure 1. Global redistribution of OCT4 binding in PGCs compared with ESCs.
(a) Cross-section of a human fetal testis (22 weeks) with immunostaining for OCT4. Enlarged panel on the right represents the region enclosed within the white dashed lines of the left panel. Scale bar represents 50 μm. Immunostaining experiments were independently repeated a minimum of three times with similar results. (b) Left panel: Heatmap visualization of OCT4 ChIP-seq data, depicting all binding events centered on the peak region within a 5kb window around the peak. Right panel: Distribution and peak heights of OCT4 peaks around the transcription start site (TSS). Peak heights are reported in reads per million (RPM). (c) Scatterplot comparing OCT4 binding in PGCs and ESCs. Selected genes known to be associated with pluripotency are highlighted in blue, and those associated with germline are highlighted in red. (d) Genome browser representation of ChIP-seq tracks for OCT4 in ESCs (red) and PGCs (yellow) at the OCT4 and PIWIL1 loci. Regions that were bound by OCT4 exclusively in ESCs or PGCs are highlighted by pink shaded boxes. ChIP-seq were independently repeated twice with similar results. (e) Venn diagram of unique and shared genes bound by OCT4 in ESCs and PGCs. Gene ontology analysis are shown in the right and bottom. Analysis were performed twice with similar results based on two independent ChIP-seq data.

