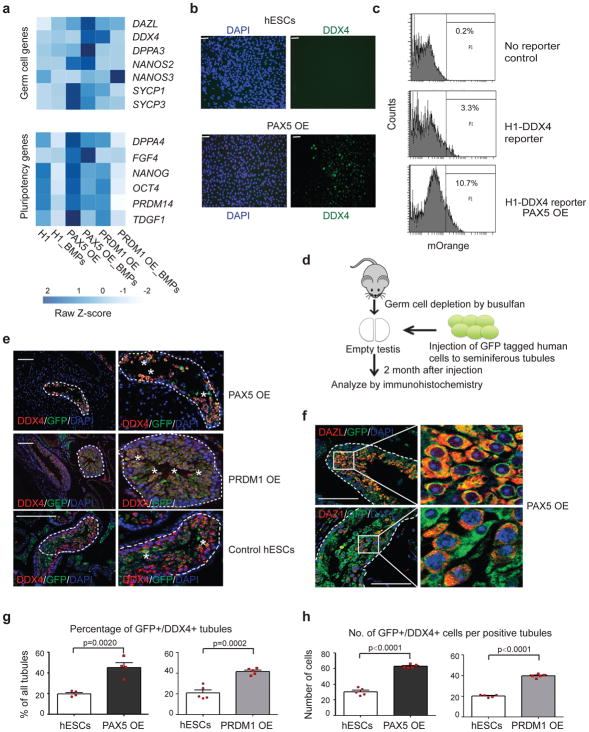
Figure 3. Overexpression PAX5 and PRDM1 enhance germ cell potential of ESCs.
(a) Heatmap of FPKM (Fragments Per Kilobase of transcript per Million mapped reads) values for genes associated with germline (top) and pluripotency (bottom). _BMPs: differentiated by BMPs; OE: overexpression. (b) Immunostaining of differentiated cells from hESCs and PAX5 OE cells for DDX4 and DAPI. Scale bars represent 50 μm. Immunostaining experiments were independently repeated a minimum of three times with similar results. (c) Gating strategy to sort mOrange+ cells from the H1 hESC line after differentiation by BMPs. (d) Schematic experimental design of xenotransplantion. Transplantations were performed by independently injecting GFP tagged human cells directly into seminiferous tubules of busulfan-treated mouse testes that were depleted of endogenous germ cells. Testis xenografts were analyzed by immunohistochemistry 2 months after injection. (e) Immunohistochemical analysis of testis xenografts derived from PAX5 OE, PRDM1 OE and control H1 hESCs. In all panels, dashed white lines indicate the outer edges of spermatogonial tubules and enlarged view are shown on the right. White asterisks represent GFP+/DDX4+ donor cells near the basement membrane. Scale bars represent 50 μm. Immunostaining experiments were independently repeated a minimum of three times with similar results. (f) Immunostaining of testis xenografts derived from PAX5 OE H1 hESCs for later stage PGC markers DAZL and DAZ1. Enlarged panel on the right represents the region enclosed within the white rectangles of the left panel. Scale bars represent 50 μm. Immunostaining experiments were independently repeated a minimum of three times with similar results. (g) Percentage of tubules positive for GFP+/DDX4+ cells were calculated across multiple cross-sections (relative to total number of tubules). Data are represented as mean ± SD of n= 4 independent replicates. P-values were calculated by two-tailed Student’s t-test. (h) For each positive tubule, the ratio of GFP+/DDX4+ cells per tubule was determined. Data are represented as mean ± SD of n=5 independent replicates. P-values were calculated by two-tailed Student’s t-test. Source data for g and h are in Supplementary Table 2.

