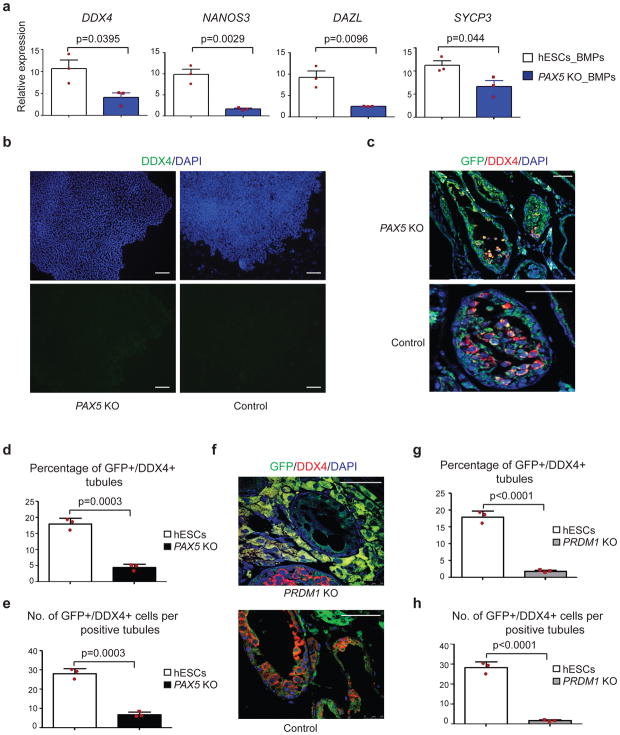
Figure 4. Knock out of PAX5 or PRDM1 reduce germ cell potential of ESCs.
(a) RT-qPCR analysis of control and PAX5 KO H1 hESCs after BMPs-induced differentiation. Abbreviations: _BMPs represents cells were differentiated by BMPs; KO represents knockout. Data are represented as mean ± SD of n=3 independent replicates. P-values were calculated by two-tailed Student’s t-test. (b) Immunostaining of differentiated cells for DDX4 (green) and DAPI stained nuclei (blue). Scale bars represent 100 μm. Immunostaining experiments were independently repeated a minimum of three times with similar results. (c, f) Immunohistochemical analysis of testis xenografts derived from PAX5 KO (c) and PRDM1 KO (f) and control H1 hESCs. All images are merged from DDX4 (red), GFP (green)and DAPI-stained nuclei. Scale bars represent 50 μm. Immunostaining experiments were independently repeated a minimum of three times with similar results. (d, g) Percentage of tubules positive for GFP+/DDX4+ cells were calculated across multiple cross-sections (relative to total number of tubules) for PAX5 KO (d) and PRDM1 KO (g) H1 hESCs. Data are represented as mean ± SD of n=3 independent replicates. P-values were calculated by two-tailed Student’s t-test. (e, h) For each positive tubule, the ratio of GFP+/DDX4+ cells per tubule was determined for PAX5 KO (e) and PRDM1 KO (h) H1 hESCs. Data are represented as mean ± SD of n=3 independent replicates. P-values were calculated by two-tailed Student’s t-test. Source data for a, d, e, g and h are in Supplementary Table 2.

