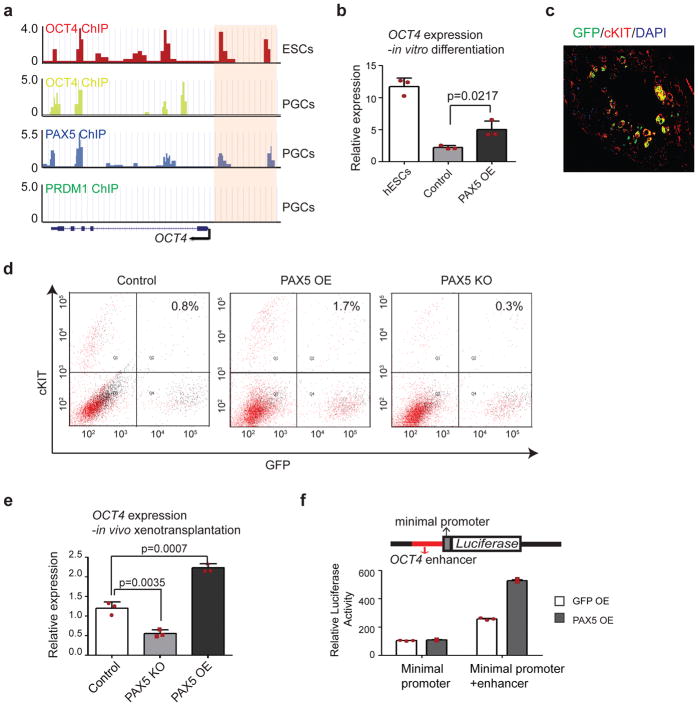
Figure 5. PAX5 acts upstream of OCT4.
(a) Genome browser representation of ChIP-seq tracks at the OCT4 locus. Enhancer regions are highlighted by pink shaded boxes. ChIP-seq were independently repeated twice with similar results. (b) OCT4 expression in hESCs and in control and PAX5 OE cells during in vitro differentiation. Data are represented as mean ± SD of n=3 independent replicates. P-values were calculated by two-tailed Student’s t-test. (c) Immunostaining of GFP and CKIT in mouse testis xenografts. Scale bar represents 50 μm. Immunostaining experiments were independently repeated a minimum of three times with similar results. (d) Flow cytometry analysis for GFP and CKIT of mouse testis xenografted. (e) RT-qPCR analysis of OCT4 expression in hPGCs formed in the mouse seminiferous tubules by PAX5 OE, PAX5 KO and control hESCs. Data are represented as mean ± SD of n=3 independent replicates. P-values were calculated by two-tailed Student’s t-test. (f) Reporter constructs used to assay for testing OCT4 enhancer activity are shown. Genomic fragment bound by PAX5 and OCT4 (in red) was inserted upstream of a luciferase gene driven by minimal promoter. Y-axis represents the fold enrichment of luciferase activity. Data are represented as mean ± SD of n=3 independent replicates. Source data for b, e and f are in Supplementary Table 2.

