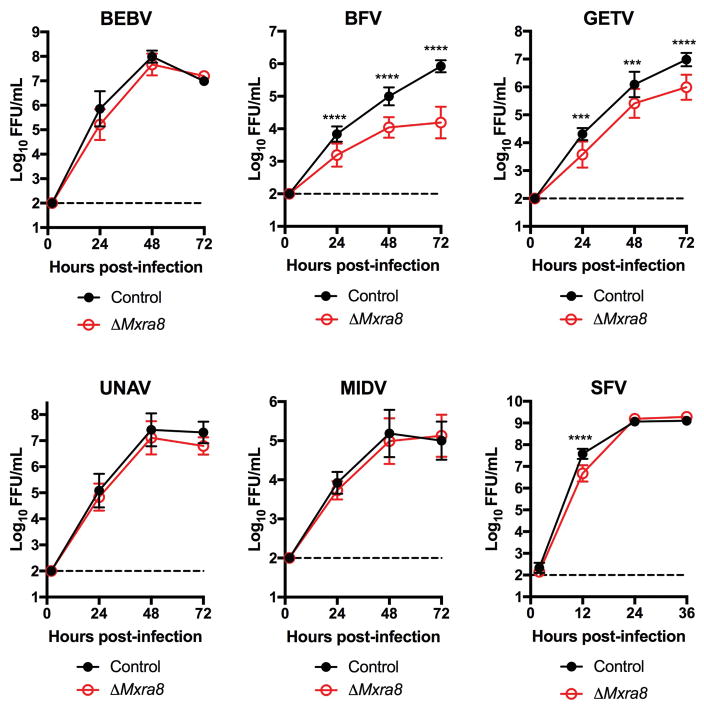
Extended Data Figure 4. Growth curves of related alphaviruses in ΔMxra8 3T3 cells.
Control and ΔMxra8 3T3 cells were inoculated with Bebaru (BEBV), Barmah Forest (BFV), Getah (GETV), Una (UNAV), Middleburg (MIDV), or Semliki Forest (SFV) viruses at an MOI of 0.01 (except for BEBV, which was at 0.001), and supernatants were harvested at the indicated times for FFA. Data are pooled from two (BEBV) or three (all others) experiments and expressed as mean ± SD (n =6, BEBV; n = 9, BFV, GETV, UNAV, and MIDV; n = 12, SFV; two-way ANOVA with Sidak’s multiple comparisons test, ***, P < 0.001; ****, P < 0.0001).

