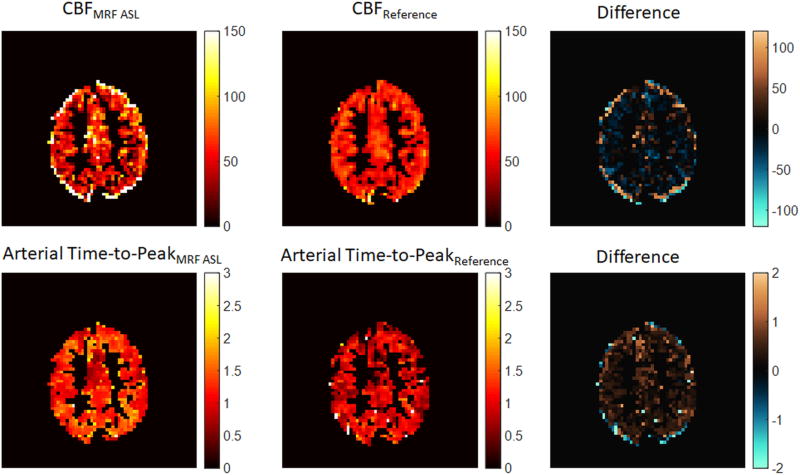
Figure 6.
(Left Top) Masked map of CBF estimated using the two-compartment model and MRF ASL acquisition in grey matter with units ml/min/100g. (Center Top) Masked map of CBF estimated using a one-compartment model and standard pCASL acquisition in grey matter with units ml/min/100g (Right Top) Subtraction of masked CBF maps (MRF ASL – pCASL Reference) with units ml/min/100g. (Left Bottom) Masked map of arterial time-to-peak estimated using the two-compartment model and MRF ASL acquisition in grey matter with units of seconds (Center Bottom) Masked map of arterial time-to-peak estimated using a two-compartment model and multiple post-label delay pCASL acquisition in grey matter with units of seconds (Right Bottom) Subtraction of masked arterial time-to-peak maps (MRF ASL – pCASL Reference) with units of seconds.

