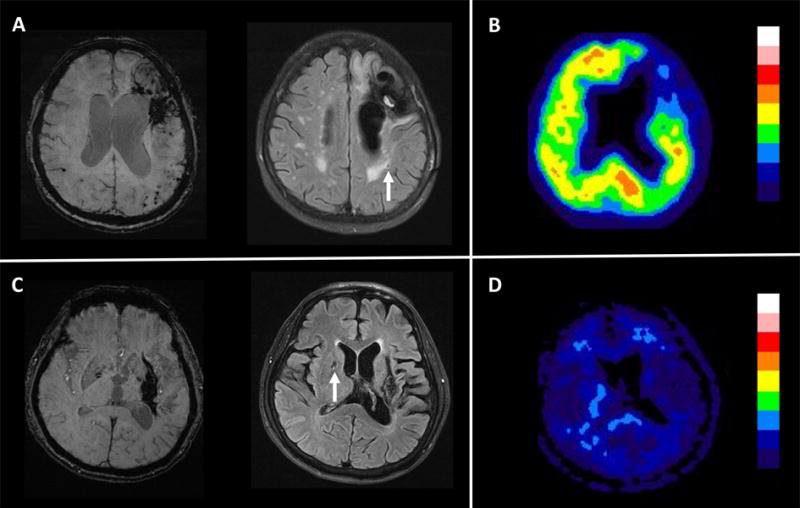
Figure 1. Figure representatives of lacune location and amyloid scan findings.

(A and B) Patient with CAA-ICH. (A) SWI showed left frontal ICH and numerous microbleeds restricted to lobar regions. Fluid-attenuated MRI sequence showing a lobar lacune (arrow). (B) PiB PET showed increased cortical amyloid retention (SUVR=1.43). (C and D) Patient with HTN-ICH. (C) SWI showed a left putaminal ICH without additional microbleed. Fluid-attenuated MRI sequence showed one deep lacune in the basal ganglia (arrow) (D) PiB PET showed absence cortical amyloid retention (SUVR=1.01).
