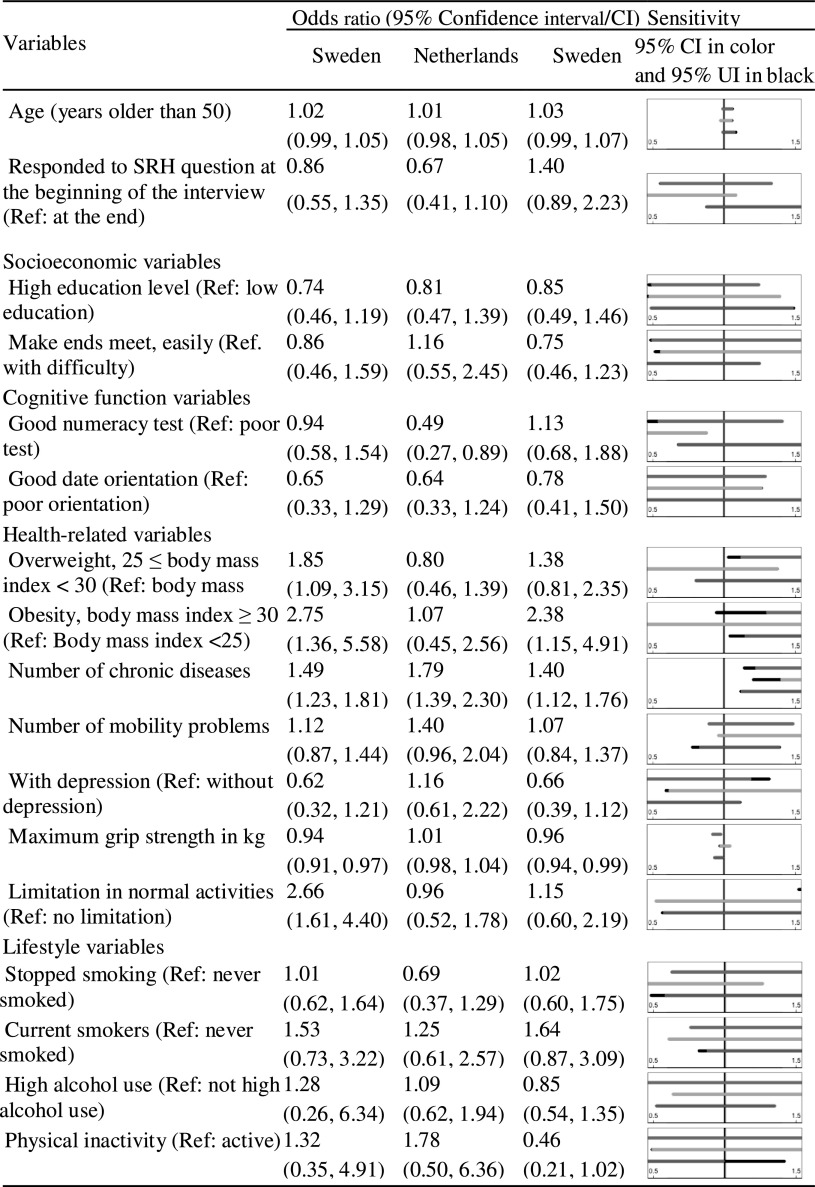
Table 4.
Odds ratios and 95% confidence intervals from the multiple logistic regressions modeling decline in SRH against all covariates for males
Figure panels show uncertainty intervals (in black) and a confidence interval (in blue, orange, and green for Sweden, the Netherlands, and Italy, respectively). The uncertainty intervals are derived assuming that the dropout mechanism is positively correlated with decline in SRH (correlation between − 0.8 and 0). (Color table online)

