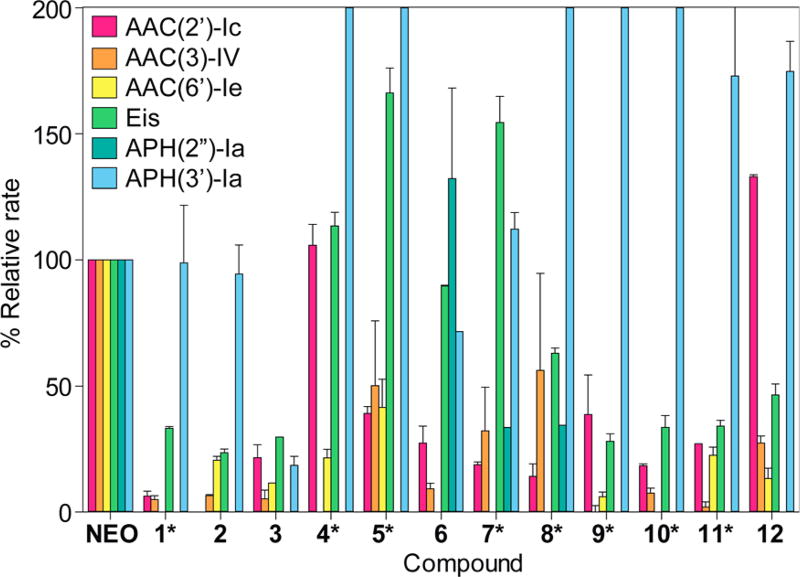
Figure 5.
Bar graph showing the relative rates of AME activity in the presence of AMA–NEO conjugates normalized to the parent aminoglycoside (NEO). The scale of the y axis was capped at 200% to highlight the usefulness of the compounds that were reacted more slowly than NEO, rather than leaving the graph at full size and highlight the compounds that reacted more quickly than NEO. For the compounds under modification by APH(3′)-Ia that went over 200% activity, the actual values follow: 4, 347 ± 94; 5, 254 ± 46; 8, 249 ± 45; 9, 292 ± 40; and 10, 278 ± 78.

