Fig. 2.
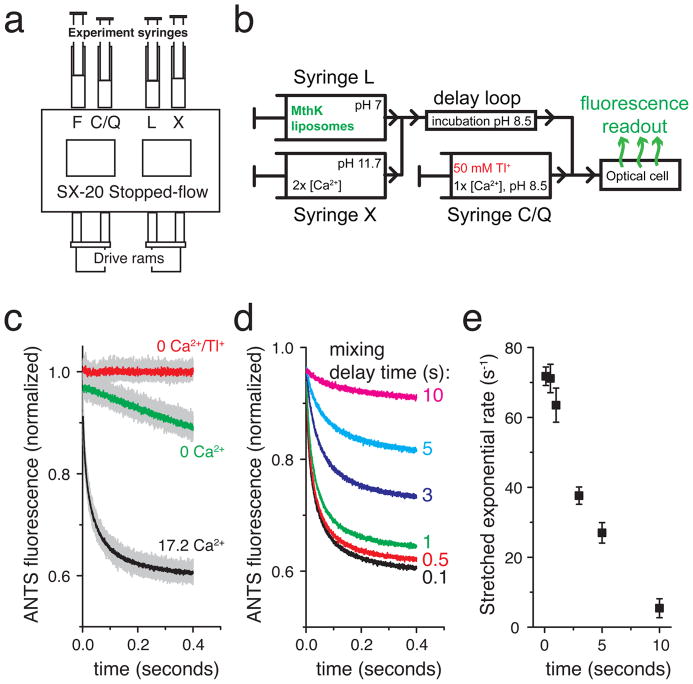
Kinetic measurements of channel activity are performed using a sequential-mixing stopped-flow spectrofluorometer. (a) Cartoon of the sample handling chamber of the SX20 stopped-flow device (Applied Photophysics). Liposomes in syringe L are mixed with experimental test conditions in syringe X. Following a user-defined reaction delay time, the L+X mixture is further mixed with the contents of syringe C/Q; C denotes a non-quenching control experiment and Q denotes a Tl+-containing quenching experiment. (b) Schematic flow diagram for the sequential mixing steps performed inside the stopped-flow apparatus for an experiment testing the Ca2+ activation of the MthK K+ channel. (c–e) Example data obtained with the MthK Ca2+-activated K+ channel. (c) Raw data from repeated mixing reactions (light gray data) with mean signal (dark data overlay) using 100 ms delay between mixing 1 and 2. Red: 0 Ca2+ in syringe X and 0 Tl+ in syringe C, Green: 0 Ca2+ in syringe X and 50 mM Tl+ in syringe Q, Black: 34.4 mM Ca2+ in syringe X and 50 mM Tl+ in syringe Q. (d) Mean ANTS fluorescence quenching time courses from the experiment in b with the mixing delay time varied between 0.1 and 10 seconds, illustrating the loss of MthK activity upon sustained exposure to Ca2+. (e) Mean stretched exponential rates from fitting individual mixing repeats from c–d to Equation 1 and calculating the rates using Equation 2. The error bars are standard deviations from the repeated mixing reactions as in c. Experimental replicates on independent samples should also be acquired.

