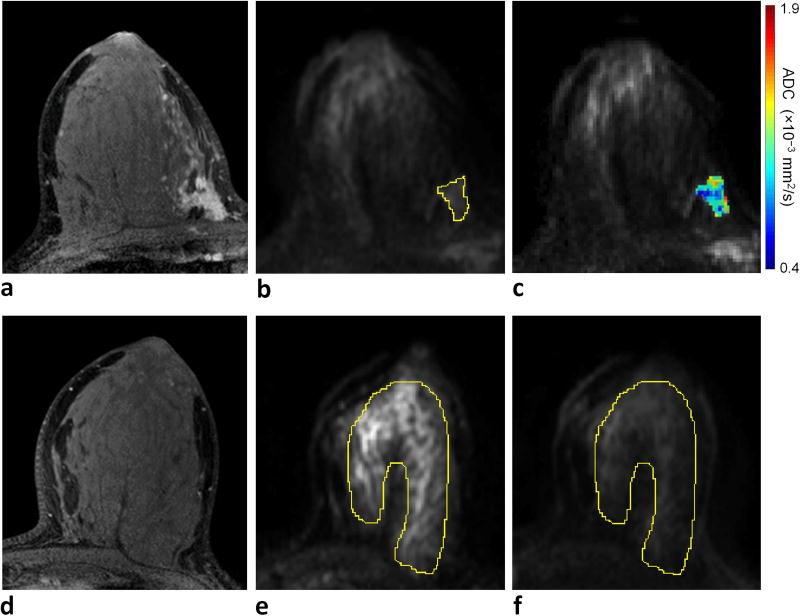
Figure 3.
Association of 21-Gene Recurrence Scores (RS) rate with a) ADCmean, b) ADCstdev, c) ADCmin, d) ADCmax, and e) DWI CNR. While associations were not statistical significant for any of the DWI parameters vs. RS by ordinal logistic regression analysis, ADCmean (a), ADCmax (d) and CNR (e) significantly differentiated high RS from low and moderate RS (p<0.05) in post-hoc comparisons. Asterisk (*) denotes significant difference (p<0.05) between high and low/moderate RS groups by post-hoc comparison without adjustment for multiple comparisons.

