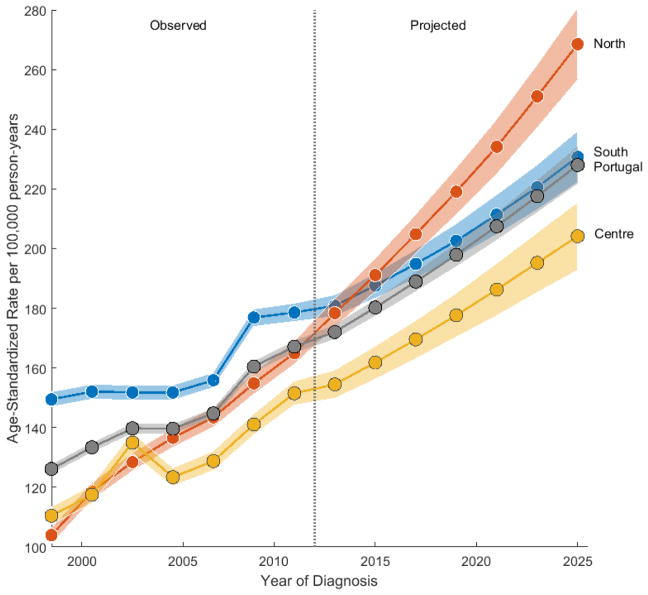
Fig. 3.
Overall observed (1998–2011) and projected (2012–2025) age-standardized rate trends for breast cancer incidence in women aged 30–84 years, by region and in Portugal (overall). Vertical reference line separates observed from forecast period. Two-year age intervals and two-year calendar periods were used to smooth curves. The rates are plotted on a linear scale. Shaded bands represent 95% confidence limits.

