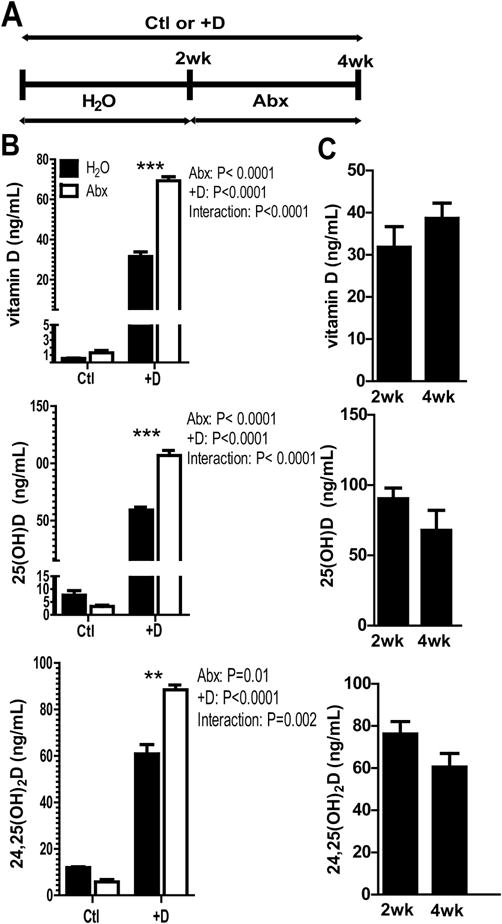
Figure 1. Abx treatments induced vitamin D metabolism.

A) Experimental design for Abx treatment and Ctl or +D supplementation. B) Vitamin D, 25D, and 24,25D levels from serum of control (Ctl) and vitamin D supplemented (+D) mice, before and after 2 wks of Abx. The results are from one representative of 3 independent experiments. Values are the mean ± SEM of n=4 mice per group. 2-way ANOVA with Bonferroni post-hoc test was used to test significance. C) Water treated D+ mice after 2 and 4 wks of vitamin D supplementation. Values are the mean ± SEM of n=5 mice per group, mixed sex. Paired t-test was used to test significance. *P<0.05, **P<0.01, ***P<0.001
