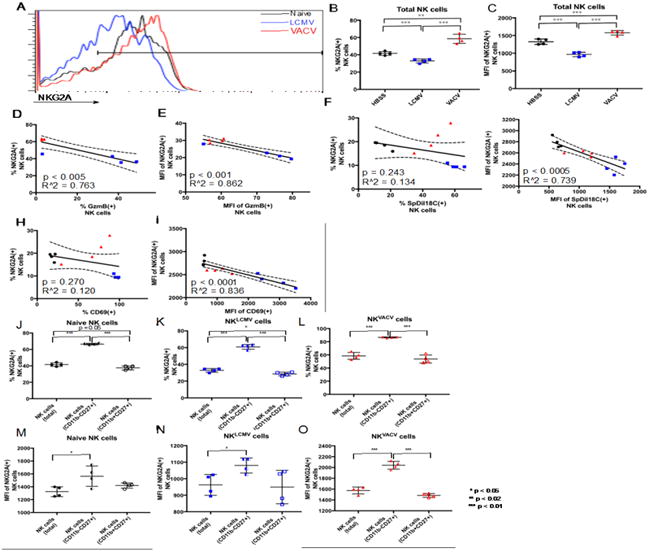
Figure 5.

Differential expression of NKG2A between LCMV- and VACV-induced splenic NK cells. A. Overlaid flow cytometry profiles showing NKG2A protein expression in NK cells from representative naive and infected mice (each histogram represents NK cells from a single mouse). B, C. NKG2A prevalence and expression level in NK cells. D, E. Correlation of NKG2A prevalence and expression level to GzmB. F. Correlation of percent NKG2A(+) NK cells to the percentage of NK cells engaged in membrane exchange. G. Correlation of NKG2A expression level in NKG2A(+) NK cells to the degree of trogocytosis in SpDiI-18C(+) NK cells. H, I. Correlation of NKG2A prevalence and expression level to CD69. L-O. Prevalence and expression levels of NKG2A for CD11 b-CD27+ and CD11b+CD27+ NK cell maturity profiles compared to total NK cells for naïve NK cells (J, M), NKLCMV cells (K, N), and NKVACV cells (L, O). * p < 0.05, ** p < 0.02, *** p < 0.01. NK cell gating scheme: Singlets (FSC)>Lymphocytes(SSC)>NK 1.1(+) CD3(-).
