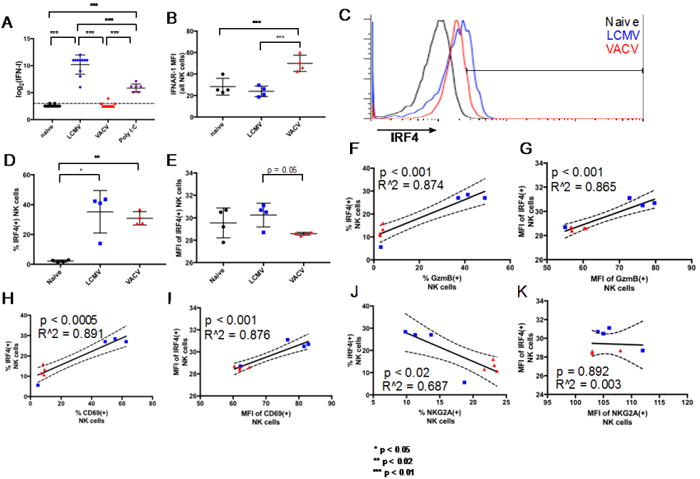
Figure 6.

Comparison of IFN-I response and IRF4 expression between LCMV- and VACV-induced splenic NK cells. A. Serum IFN-I titers. B. Average IFNAR1 expression on all NK cells present in naïve, LCMV-, and VACV-infected mice. C. Overlaid flow cytometry profiles showing IRF4 protein expression in NK cells from representative naive and infected mice (each histogram represents NK cells from a single mouse). D, E. IRF4 prevalence and expression levels in NK cells. F-I. Correlation of IRF4 prevalence and expression levels to GzmB and CD69. J, K. Correlation of IRF4 prevalence and expression level to NKG2A. * p < 0.05, ** p < 0.02, *** p < 0.01. NK cell gating scheme: Singlets (FSC)>Lymphocytes(SSC)>NK 1.1(+) CD3(-).
