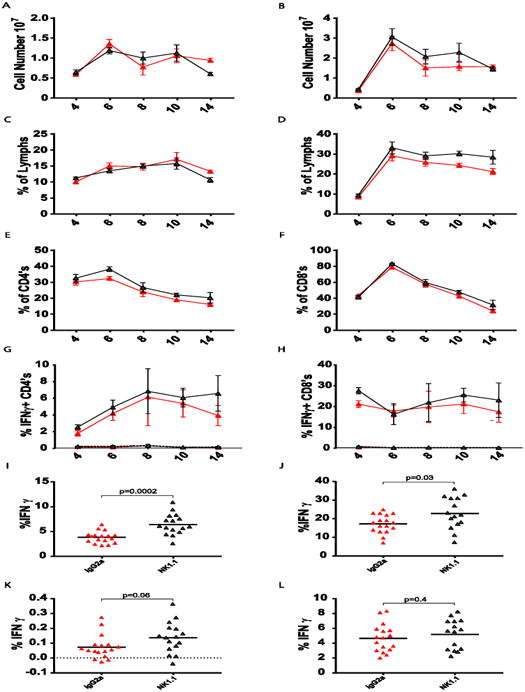
Figure 7.

Effects of VACV-induced NK cells on T cell populations. VACV-infected mice were treated with either monoclonal antibody against NK1.1 (red) or the non-depleting isotype control antibody (grey) prior to infection. Data in panels A-H are pooled from three identical experiments, with n = 8-10 per group, except for day 14, which was one experiment in a complete time course with n = 5 per group. Day 14 data from panels I-L are pooled data from four identical experiments. A, B. Comparison of CD4 and CD8 T cell population size in the presence and absence of NK cells. C, D. CD4 and CD8 T cell percentages in the presence and absence of NK cells. E, F. CD4act and CD8act cell percentages in the presence and absence of NK cells, as indicated by co-expression of CD43 and CD44. G, H. Percentages of IFNy(+) CD4 and CD8 T cells responsive to activation by antibody to CD3ε (solid lines) or control background (dotted lines), in the presence and absence of NK cells. I, J. Percentages of anti-CD3-activated IFNγ(+) CD4 and CD8 T cells in the presence and absence of NK cells at day 14 post-infection. K. B5R-specific antiviral IFNγ (+) CD4 T cell response at day 14 p.i. with the background IFNγ (+) percentage subtracted. L. The immunodominant B8R-specific antiviral IFNγ (+) CD8 T cell subpopulation at day 14 with the background IFNγ (+) percentages subtracted. T cell pre-gating scheme: Singlets (FSC)>Lymphocytes(SSC).
