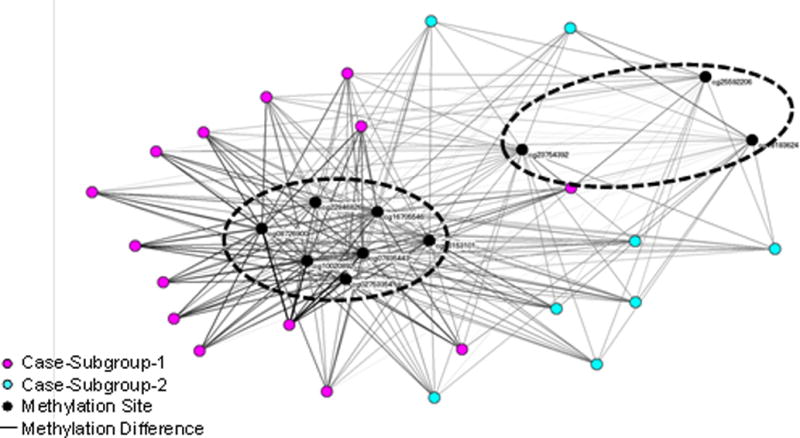
Figure 4.

Bipartite network visualization of 22 cases and 10 methylation sites. The network revealed two clusters of cases, and the methylation sites that were strongly associated with each. The dashed ovals denote boundaries of case clusters identified through agglomerative hierarchical clustering.
