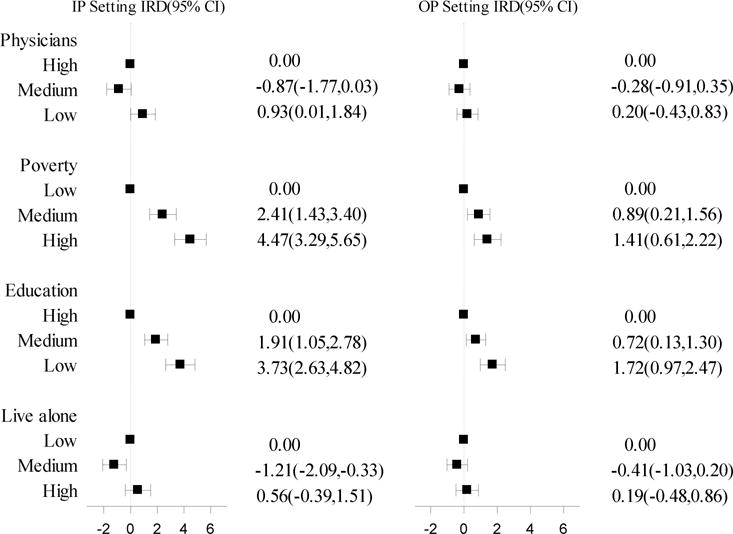
Figure 2.

Incidence rate differences (95% CI) per 1,000 person-years of diagnosis of HF in the inpatient and outpatient setting by area-level SES and access to care factors, CMS Medicare FFS Beneficiaries (2001 – 2013) (IP Setting n=105,013, OP Setting n=97,295).
Footnotes: abbreviations- CI (Confidence Interval), FFS (fee-for-service), HF(Heart Failure), IRD (Incidence Rate Difference), IP (Inpatient), OP (Outpatient), SES (Socio-Economic Status). Category boundaries: physicians (number of primary care physicians per 100,000 population), low (0-29.4), medium (29.5-78.6), high (78.7-400); poverty (proportion > 65 in poverty) low (0 - 0.054), medium (0.055–0.088), high (0.089-0.370); education (proportion > 65 with > high school education) low (0-0.25), medium (0.25-0.42), high (0.43-0.78); live alone (proportion > 65 that live alone) low (0-0.27), medium (0.28-0.31), high (0.32-0.60).
