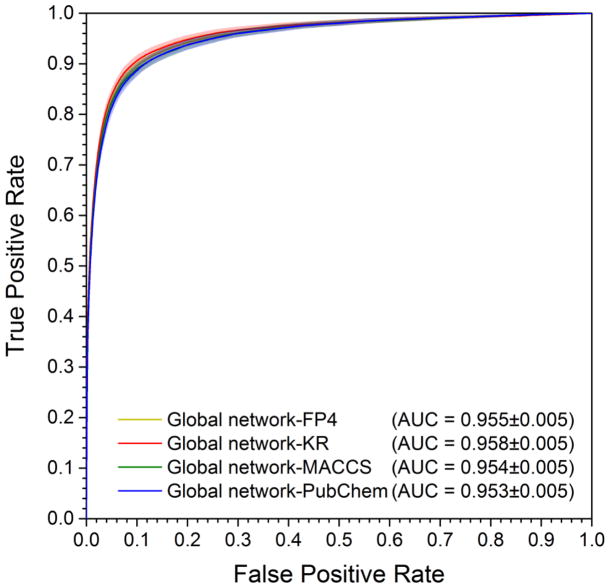
Figure 3. Receiver operating characteristic (ROC) curves of four models in 10-fold cross validation.
For each model, the processes of 10-fold cross validation were repeated 10 times, and the mean values and standard deviation (mean±SD) of each evaluation indicator were calculated to measure the model performance. The shadow of each curve denotes the SD.

