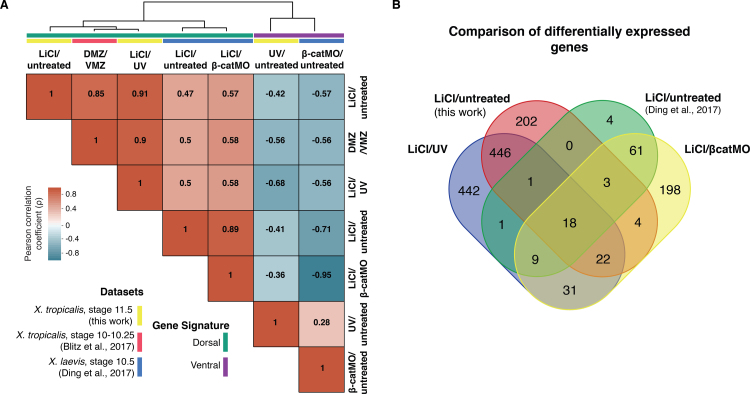
Fig. S4.
Comparative transcriptomics of DV axis determination. (A) Pairwise Pearson correlations of indicated transcriptional comparisons of the DV core genes. This includes work from Blitz et al. (2017) and Ding et al., 2017a, Ding et al., 2017b. Conditions were clustered according to Euclidean distances. (B) Venn diagram comparing genes identified as differentially expressed between indicated conditions (transcriptional fold change ≥ 2 with FDR ≤ 1%). LiCl/untreated (stage 11.5), LiCl/UV (stage 11.5), LiCl/untreated (stage 10.5; Ding et al., 2017) and LiCl/βcatMO (stage 10.5; Ding et al., 2017).

