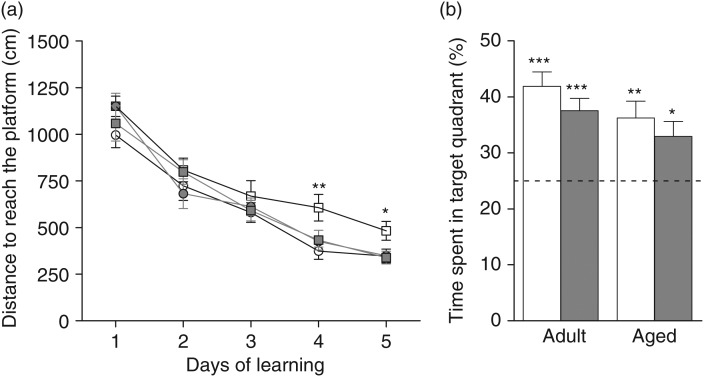
Fig. 3.
Spatial learning and memory. (a) Distance to reach the platform in adult control mice (–○–), adult mice fed the polyphenol-rich extract from grape and blueberry (PEGB)-enriched diet ( ), aged control mice (–□–) and aged PEGB-enriched diet-fed mice (
 ). Values are means, with their standard errors represented by vertical bars (n 14–20 per group). Performance differed significantly on days 4 and 5 of the learning phase (* P < 0·05, ** P < 0·01 v. adult control). (b) Percentage of time spent by control mice (
 ) and PEGB-enriched diet-fed mice (
 ) in the target quadrant during the probe test. The dotted line corresponds to chance level (25 %). Values are means, with their standard errors represented by vertical bars (n 14–20 per group). All groups remembered the platform location, as they spent more time in the target quadrant (* P < 0·05, ** P < 0·01, *** P < 0·001 v. chance level).

