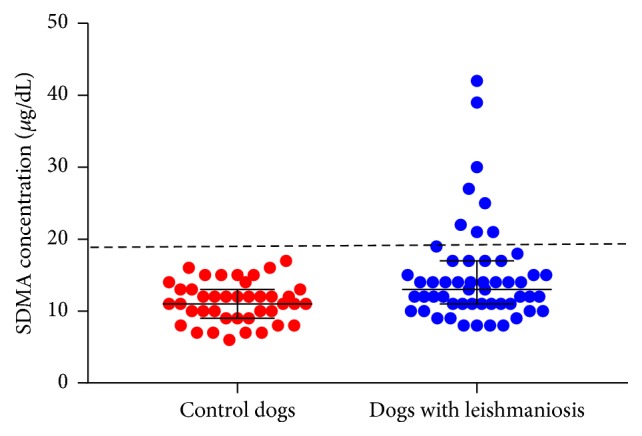
Figure 2.

Distribution of SDMA concentrations in 53 dogs with leishmaniosis on the day of diagnosis (blue dots) and 41 control dogs (red dots). The large black bar indicates the median of each group and the whiskers indicate the interquartile range. The dashed line indicates SDMA concentration of 19 μg/dL.
