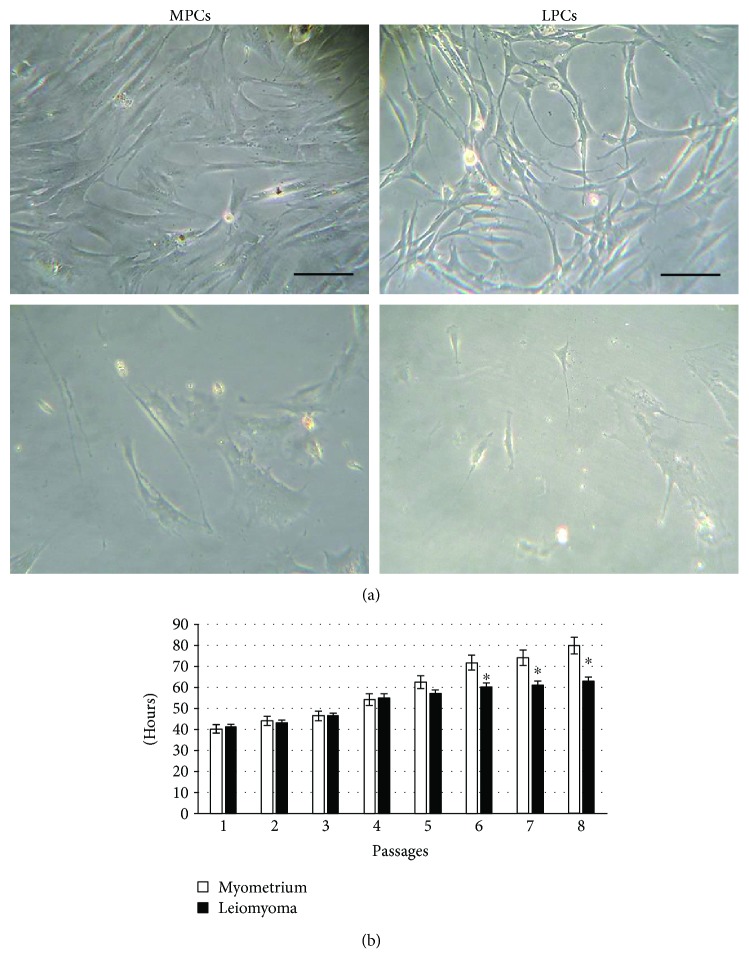
Figure 1.
Cell morphology and doubling time. (a) Phase-contrast images of myometrium progenitor cells (MPCs, left) and leiomyoma progenitor cells (LPCs, right) at 2nd (top) and 4th (bottom) passage of culture. Scale bar = 100 μm. (b) Doubling time was calculated over 21 days (8th passage). Data are mean ± SD of experiments performed on 12 samples. ∗p < 0.05 LPCs versus MPCs.

