
Figure 2.
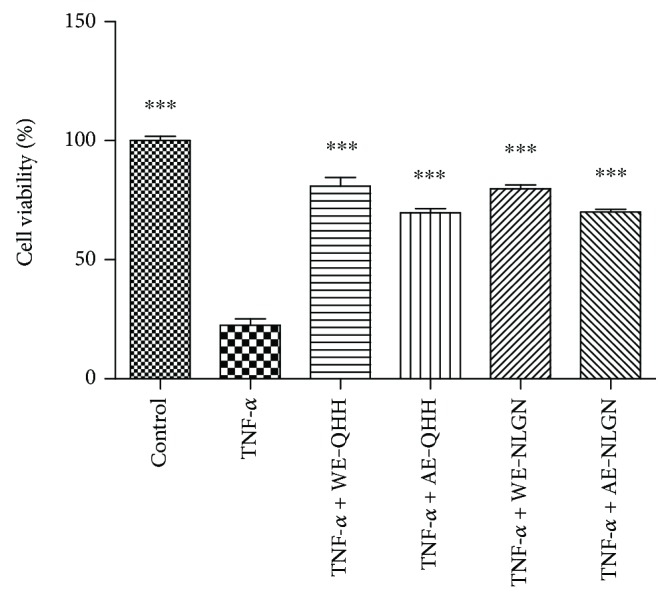
Effects of the water and alkaline extracts from QHH and NLGN on cell viability. ∗∗∗ indicates P < 0.001 versus the TNF-α group.
Official websites use .gov
A
.gov website belongs to an official
government organization in the United States.
Secure .gov websites use HTTPS
A lock (
) or https:// means you've safely
connected to the .gov website. Share sensitive
information only on official, secure websites.
Effects of the water and alkaline extracts from QHH and NLGN on cell viability. ∗∗∗ indicates P < 0.001 versus the TNF-α group.