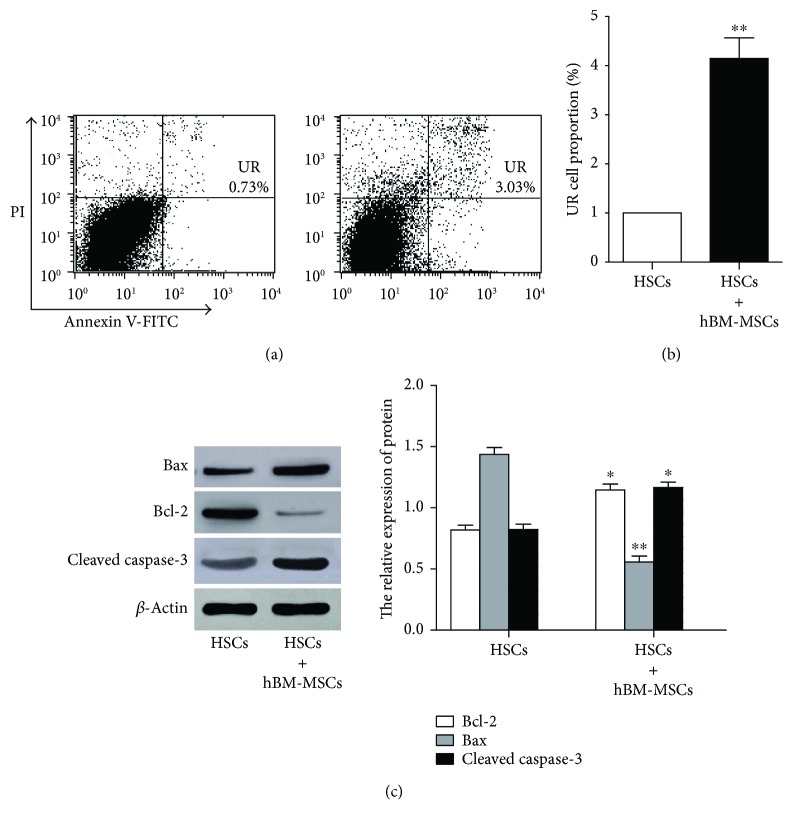
Figure 3.
hBM-MSCs induce apoptosis process in activated HSCs. (a, b) The apoptosis of the cells was measured using flow cytometry in single cultures and cocultures at 72 hours. ∗∗P < 0.01 versus the control group. (c) The protein Bax, cleaved caspase-3, and Bcl-2 protein in single cultures and cocultures at 72 hours were, respectively, analyzed by Western blot analysis. ∗P < 0.05 versus the control group and ∗∗P < 0.001 versus the control group.

