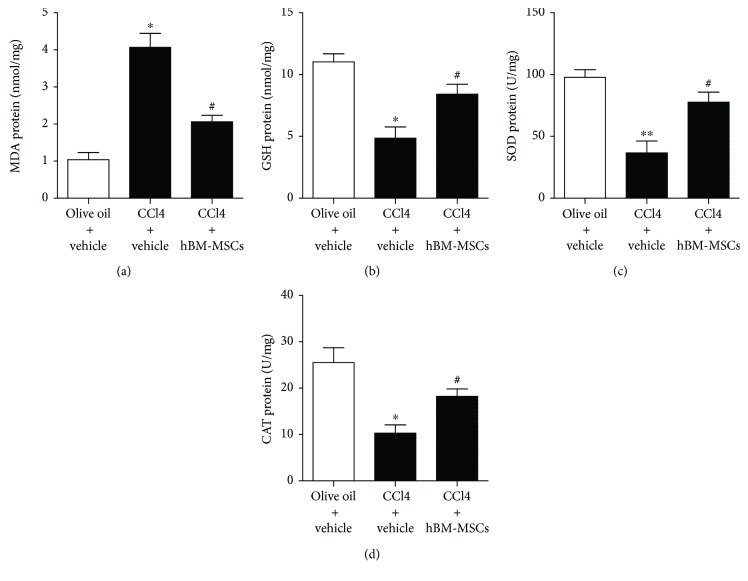
Figure 8.
Effects of hBM-MSCs on MDA, GSH, SOD, and CAT level in liver tissues. The levels of MDA, GSH, SOD, and CAT in liver tissues in the three groups were detected with chromatometry. ∗P < 0.05 versus the control group. ∗∗P < 0.001 versus the control group. #P < 0.05 versus the mice of group treatment with CCI4 plus vehicle.

