Figure 1.

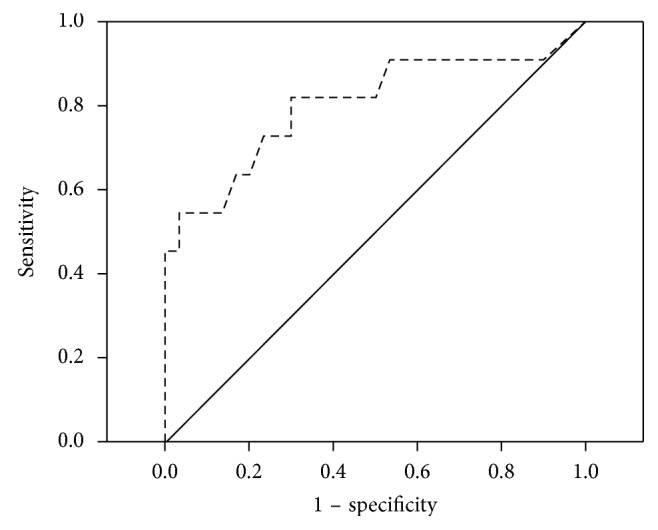
ROC curve depicting sensitivity and specificity of the ECAS, when comparing the PD and PSP patients (higher sensitivity scores indicate lower performance).

ROC curve depicting sensitivity and specificity of the ECAS, when comparing the PD and PSP patients (higher sensitivity scores indicate lower performance).