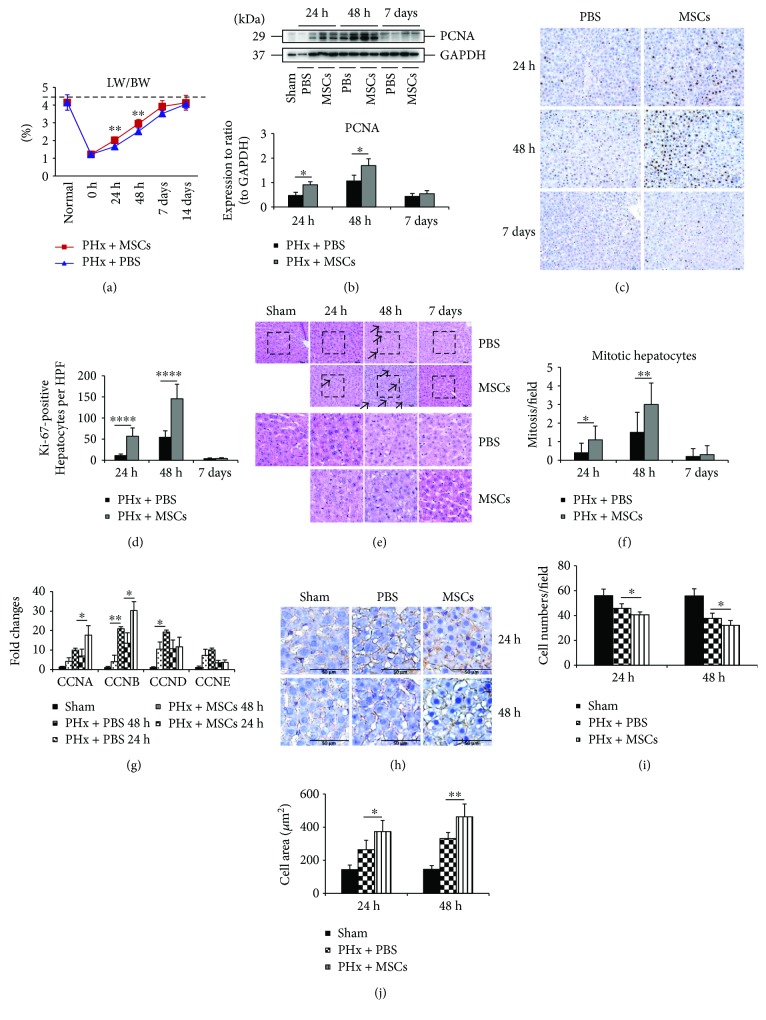
Figure 1.
Effects of MSCs on LR after PHx. (a) The ratio of the remaining liver weight to total body weight (LW/BW) at 24 h, 48 h, and 7 days after PHx in rats (n = 6). (b) The expression of PCNA by Western blot in each group at 24 h, 48 h, and 7days after PHx. (c) Immunohistochemical staining of ki-67 in the liver specimens of each group at 24 h, 48 h, and 7 days after PHx. (d) Percentage of ki-67-positive cells in each group at 24 h, 48 h, and 7 days after PHx (n = 6). (e) RT-qPCR analysis showed the expression of genes related to mitosis (CCNA, CCNB, CCND, and CCNE) (n = 3). (f) & (g) H&E staining of liver specimens of each group at 24 h, 48 h, and 7 days after PHx and the number of mitotic hepatocytes on each group (n = 6). (h) Immunohistochemical staining of β-catenin in order to show the hepatocyte membrane and count the number of cells (n = 6). Values represent mean ± SD. ∗ p < 0.05; ∗∗ p < 0.01; ∗∗∗∗ p < 0.0001.

