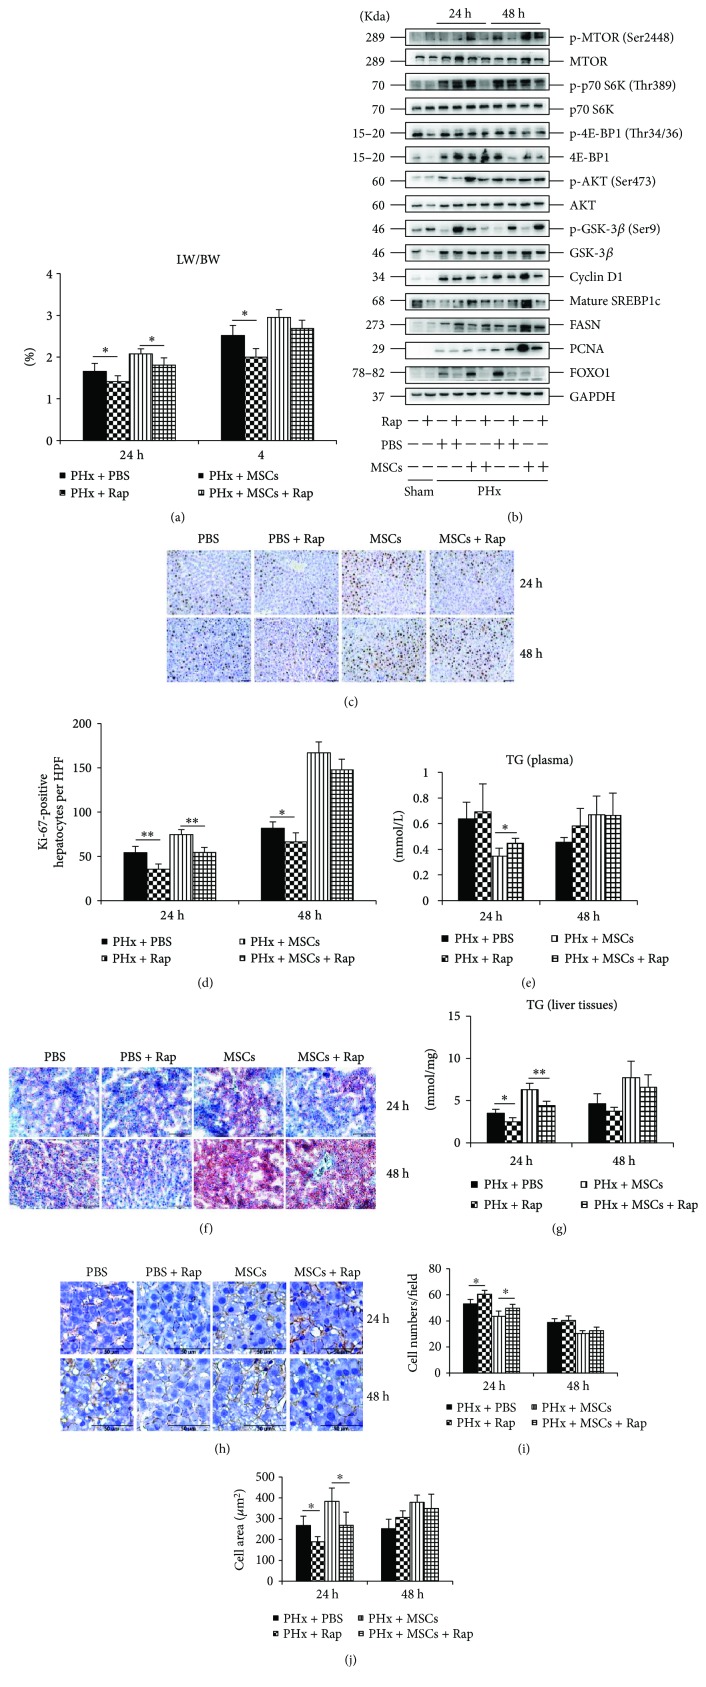
Figure 4.
Effects of rapamycin on the infusion of MSCs in LR. (a) The ratio of the remaining liver weight to body weight (LW/BW) after Rap administration on each group at 24 h and 48 h after PHx (n = 6). (b) Western blotting analysis of mTOR signaling after rapamycin administration and the expression of the proliferation marker (PCNA). (c, d) ki-67 staining of liver specimens in each group and the number of ki-67-positive cells in each group (n = 4). (e) The level of TG in plasma (n = 4). (f) Oil Red O staining of liver specimens in each group at 24 h and 48 h. (g) The level of TG in liver specimens (n = 4). (h) β-Catenin staining of liver specimens (n = 4). Values represent mean ± SD. ∗ p < 0.05; ∗∗ p < 0.01.

