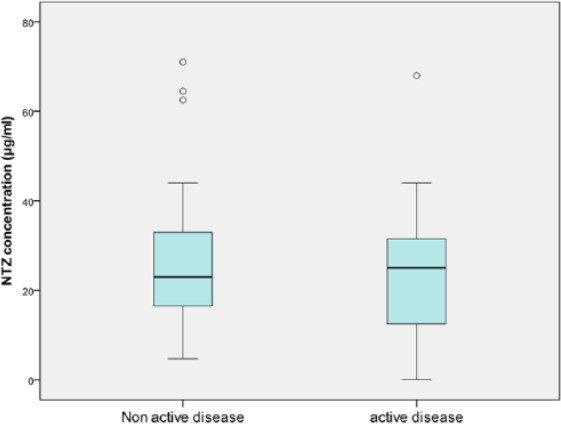
Figure 3.

Active disease (n = 15) versus non-active disease (n = 65) (according to the 2013 Lublin criteria) and NTZ trough concentrations (OR = 0.98; 95% CI = 0.94 to 1.03; p = 0.41).

Active disease (n = 15) versus non-active disease (n = 65) (according to the 2013 Lublin criteria) and NTZ trough concentrations (OR = 0.98; 95% CI = 0.94 to 1.03; p = 0.41).