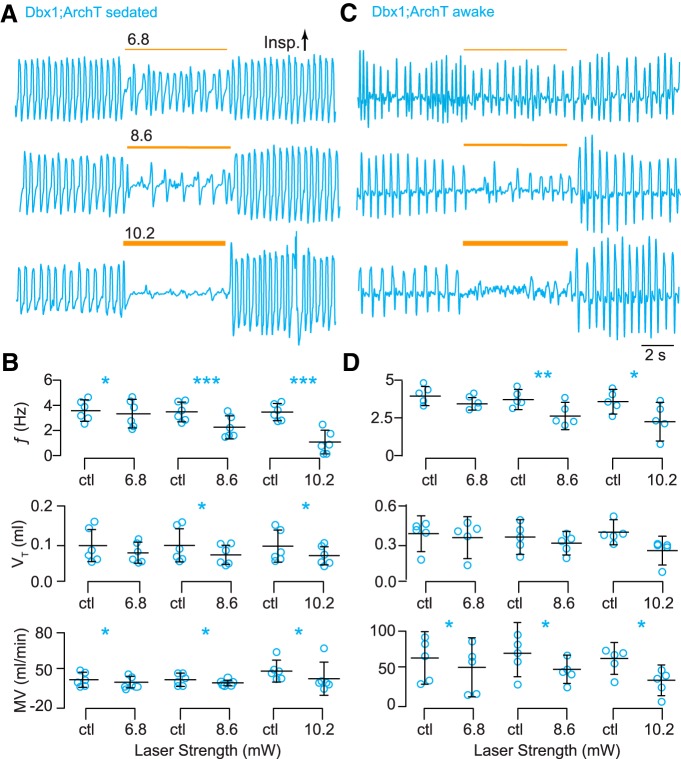
Figure 3.
Photoinhibition of Dbx1 preBötC neurons depresses breathing in adult Dbx1;ArchT mice. A, Airflow traces from a sedated mouse exposed to 5-s bouts of bilateral preBötC illumination at three intensities (units of mW). Yellow line thickness corresponds to light intensity, which is also annotated above each line. B, Group data from experiments in A quantifying light-evoked changes in ƒ, VT, and MV. Symbols show the mean ƒ, VT, and MV measured in each mouse. Bars show the mean and SD for all animals tested (n = 6). Control measurements are labeled ctl; numerals indicate light intensity. C, Airflow traces from an awake unrestrained mouse exposed to 5-s bouts of bilateral preBötC illumination at three intensities. Yellow line thickness corresponds to light intensity; annotations match those in A. D, Group data from experiments in C quantifying light-evoked changes in ƒ, VT, and MV. Symbols show the mean ƒ, VT, and MV measured in each mouse. Bars show the mean and SD for all animals tested (n = 5). Control measurements are labeled ctl; numerals indicate light intensity. Asterisks represent statistical significance at p < 0.05; the double asterisk represents p < 0.01; and triple asterisks represent p < 0.001.

