Figure 1.
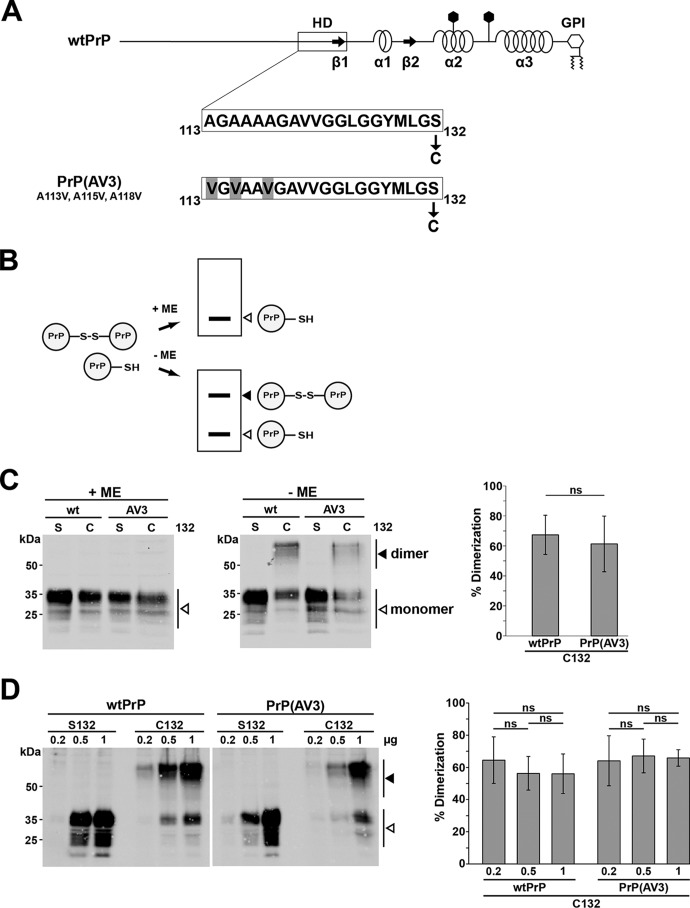
A neurotoxic mutant of PrP forms homodimers similarly to WTPrPC. A, schematic presentation of the constructs analyzed. Straight line, intrinsically disordered regions; box, highly conserved HD; arrows, β-strands (β). α-Helical structure is indicated by helices, polygons represent N-linked glycosylation acceptor sites, and GPI indicates the GPI anchor. The amino acid sequences of the HD of WTPrPC and PrP(AV3) are shown in the detail magnification. In some constructs, serine 132 is replaced by cysteine (denoted C132) to allow formation of an intermolecular disulfide bond. Numbering of the amino acids refers to human prion protein. B, scheme of the experimental strategy. In case PrP-C132 forms an intermolecular disulfide bond, PrP dimers can be separated from PrP monomers on SDS-PAGE under oxidizing conditions (−ME). Under reducing conditions (Laemmli sample buffer containing ME), only PrP monomers are detected by Western blotting (+ME). C, PrP forms disulfide bond–stabilized homodimers in neuronal cells. N2a cells were transiently transfected with WTPrP or PrP(AV3) containing a serine (S132) or cysteine (C132) at amino acid 132. Cell lysates were prepared and denatured by boiling in Laemmli sample buffer with (+ME) or without reducing agent (−ME). White arrowheads represent monomeric PrP; the black arrowhead indicates PrP homodimers. Right panel, quantifications of the dimerization efficiency measured densitometrically. ns, not significant. Data represent mean ± S.D. of ≥3 independent experiments. D, homodimerization is not due to overexpression. N2a cells were transiently transfected with different DNA amounts of the PrP variants as indicated. Cell lysates were analyzed by Western blotting in the absence of reducing agents. A white arrowhead represents the monomeric prion protein; the black arrowhead represents the homodimer. Please note that a longer exposure compared with the blots in C is shown to visualize the bands in the 0.2-μg samples. Right panel, quantifications of the dimerization efficiency. ns, not significant. Data represent mean ± S.D. of five independent experiments. Error bars represent S.D.

