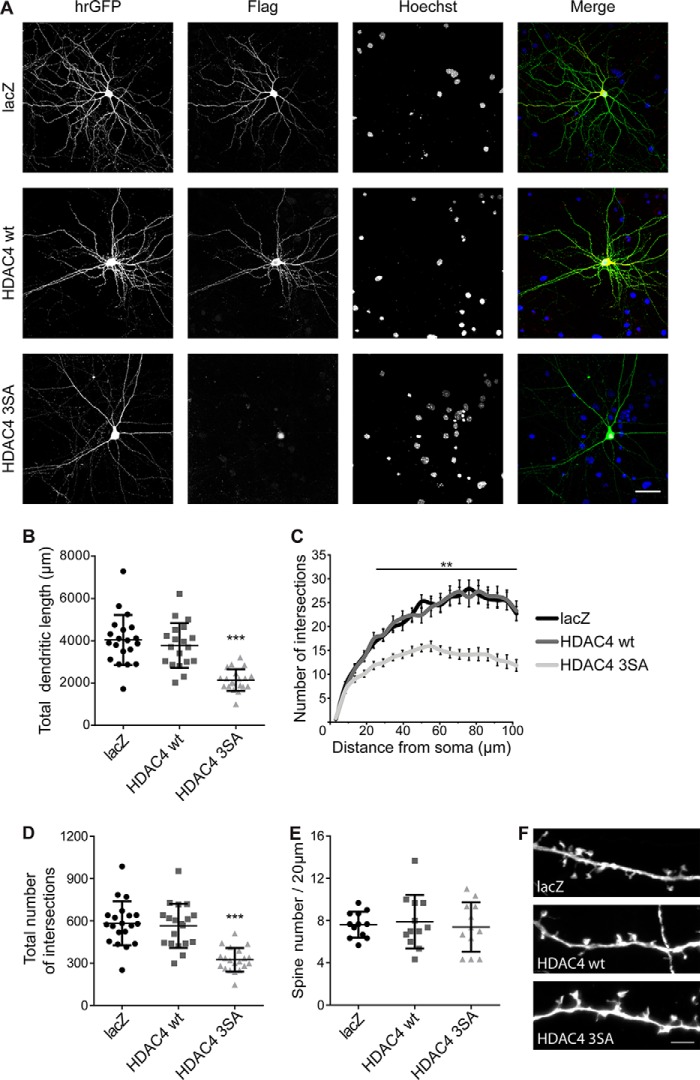
Figure 1.
Nuclear accumulation of HDAC4 results in a deterioration of neuronal morphology. A, representative images of cultured hippocampal neurons co-transfected with hrGFP and FLAG-tagged constructs HDAC4 WT, HDAC4 3SA, or lacZ. hrGFP fluorescence reveals neuronal architecture. FLAG tags were used to confirm the subcellular localization of lacZ, HDAC4 WT, and HDAC4 3SA. Nuclei were stained with Hoechst. Scale bar is 40 μm. B, quantification of the total dendritic length of hippocampal neurons transfected as in A. HDAC4 3SA versus HDAC4 WT, p = 1.65 × 10⁻⁵; HDAC4 3SA versus lacZ, p = 1.1 × 10⁻⁵; lacZ versus HDAC4 WT, p = 0.68. C, Sholl analysis of hippocampal neurons transfected as indicated. D, total number of intersections derived from the Sholl analysis shown in C. HDAC4 3SA versus HDAC4 WT, p = 1 × 10⁻⁴; HDAC4 3SA versus lacZ, p = 1 × 10⁻⁴; lacZ versus HDAC4 WT, p = 0.61. E, quantification of spine density transfected as indicated. F, representative images of dendritic spines of hippocampal neurons transfected as in E. Scale bar is 5 μm. In total, 20 neurons (lacZ and HDAC4 3SA) and 19 neurons (HDAC4 WT) from 5 independent experiments were analyzed for each construct (B–D). For spine density analysis 12 neurons from 3 independent experiments were analyzed for each construct (E). Statistically significant differences were determined by one-way ANOVA (B, D, and E) and two-way ANOVA (C), followed by Tukey's post hoc test. ***, p < 0.001; **, p < 0.01. For scatter plots, each point represents a value derived from one neuron. Graphs represent mean ± S.D.

