Figure 8.
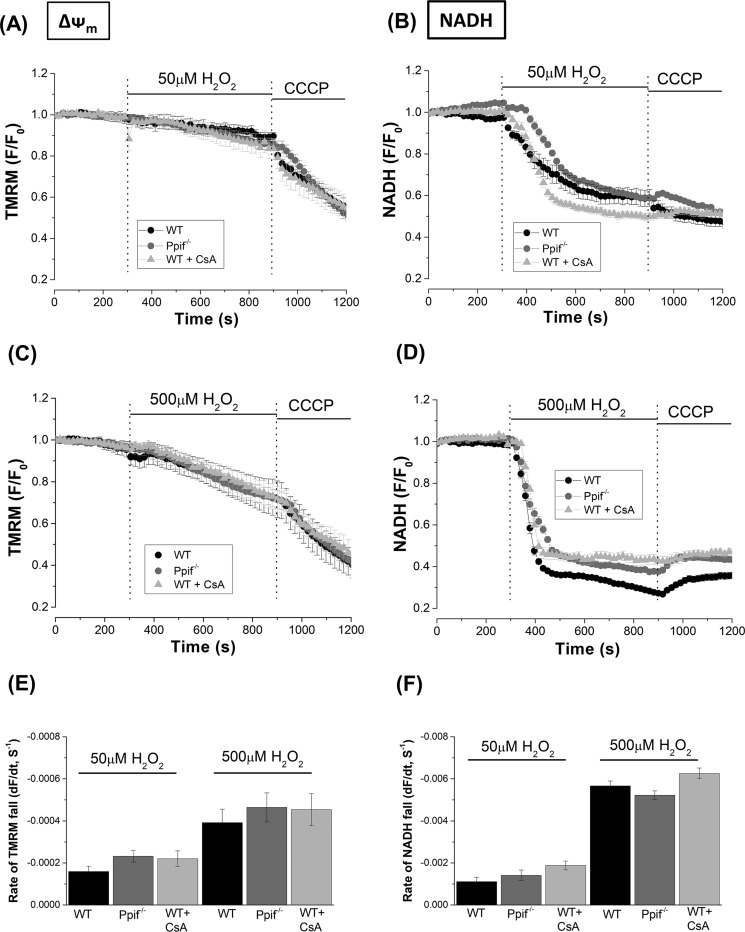
Effects of cyclophilin D knockout (Ppif−/−) and pharmacological inhibition on H2O2-induced mitochondrial depolarization and reduction of NADH. A–D, the effects of 50 μm (A and B) and 500 μm (C and D) H2O2 on mitochondrial membrane potential (ΔΨm) and NADH autofluorescence in pancreatic acinar cells isolated from Ppif−/− (gray) and WT (C57Bl6, black) mice. The effects of cyclosporine A (CsA) treatment on changes in WT to H2O2 are also shown. Changes are expressed as normalized decreases of TMRM fluorescence and falls of NADH from basal levels (F/F0); the mitochondrial uncoupler CCCP (10 μm) was applied to show maximal depolarization. E and F, the concentration-dependent rates of fall of TMRM fluorescence and NADH autofluorescence in response to H2O2 under the various conditions are displayed. All data are shown as the means ± S.E. (averages of ≥80 cells from >4 animals).

