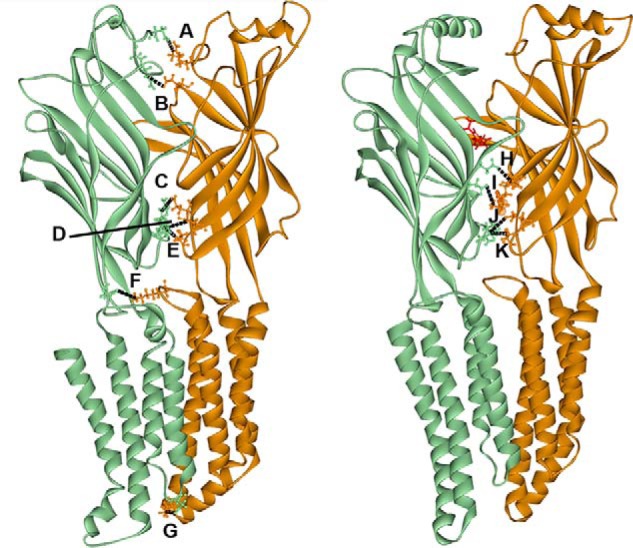
Figure 1.

Two different homology models of the α1 (orange)–γ2 (green) interface of the GABAAR. The model on the left is based on a modified ivermectin-unbound GluCl crystal structure (17) and represents the GABA-unbound closed state of the channel. The model on the right is based on the glutamate-bound GluCl crystal structure with a contribution from the ELIC crystal structure (18) and represents the diazepam (in red)-bound receptor. Both models depict the inside of the interface. Labeled interactions represent putative electrostatic interactions of residues 6 Å or less apart that are predicted to occur between residues in the α1 and γ2 subunits before (A–F) or after (H–K) diazepam binding. A, α1 Arg28–γ2 Asp26; 5 Å. B, α1 Glu165–γ2 Arg97; 4 Å. C, α1 Glu137–γ2 Arg194; 5 Å. D, α1 Glu58–γ2 Arg197; 5 Å. E, α1 Asp56–γ2 Arg197; 5 Å. F, α1 Lys278–γ2 Asp161; 5 Å. G, α1 Lys311–γ2 Asp260; 3 Å. H, α1 Lys105–γ2 Asp120; 5 Å. I, α1 Lys104–γ2 Asp75; 5 Å. J, α1 Glu58–γ2 Arg197; 5 Å. K, α1 Asp56–γ2 Arg197; 6 Å. Black dashed lines represent intersubunit bonds.
