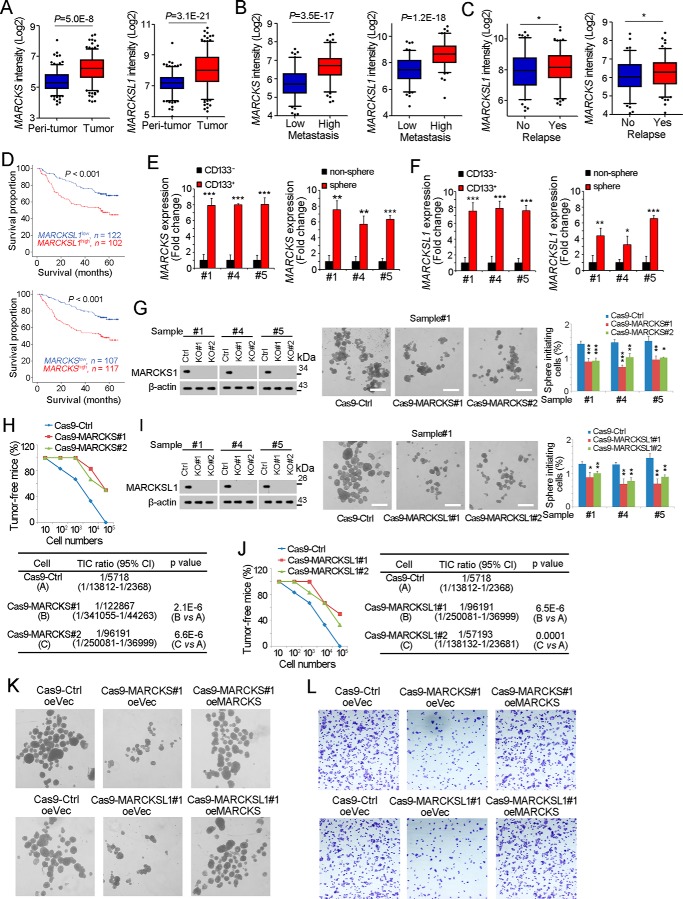
Figure 4.
MARCKS and MARCKSL1 are required for liver TIC self-renewal. A, MARCKS and MARCKSL1 intensities of peritumor and tumor samples in GSE14520 are shown as box and whisker plots. Horizontal lines, median; boxes, interquartile range; whiskers, 5–95 percentile; OE, overexpression. B and C, MARCKS and MARCKSL1 expression intensity in metastasis (B) and relapse (C) samples. D, HCC samples were divided into two groups according to MARCKS (top panel) or MARCKSL1 (bottom panel) expression, followed by Kaplan-Meier survival analyses. E and F, total RNA was extracted from CD133+ liver TICs and spheres, followed by real-time PCR analyses for MARCKS (E) or MARCKSL1 (F) expression. G, MARCKS knockout primary cells were generated through the CRISPR/Cas9 approach, followed by a sphere formation assay. MARCKS knockout efficiency was examined by Western blotting; typical sphere images are shown in the center panels, and sphere initiating ratios are shown in the right panel. Ctrl, control. H, 10, 1 × 10², 1 × 10³, 1 × 10⁴, and 1 × 10⁵ MARCKS knockout and control cells were subcutaneously injected into BALB/c nude mice, followed by 3 months of tumor initiation. The ratios of tumor-free mice are shown in the top panel, and liver TIC ratios were calculated through extreme limiting dilution analysis (bottom panel). I, MARCKSL1 knockout cells were generated through the CRISPR/Cas9 approach, followed by a sphere formation assay. J, gradient MARCKSL1 knockout and control cells were used for a tumor initiation assay. Tumor-free ratios and liver TIC ratios are shown. K and L, MARCKS/MARCKSL1 were rescued in MARCKS/MARCKSL1 knockout cells, followed by sphere formation (K) and transwell invasion assays (L). Typical images are shown. Experiments were repeated at least three times. *, p < 0.05; **, p < 0.01; ***, p < 0.001, by t test.

