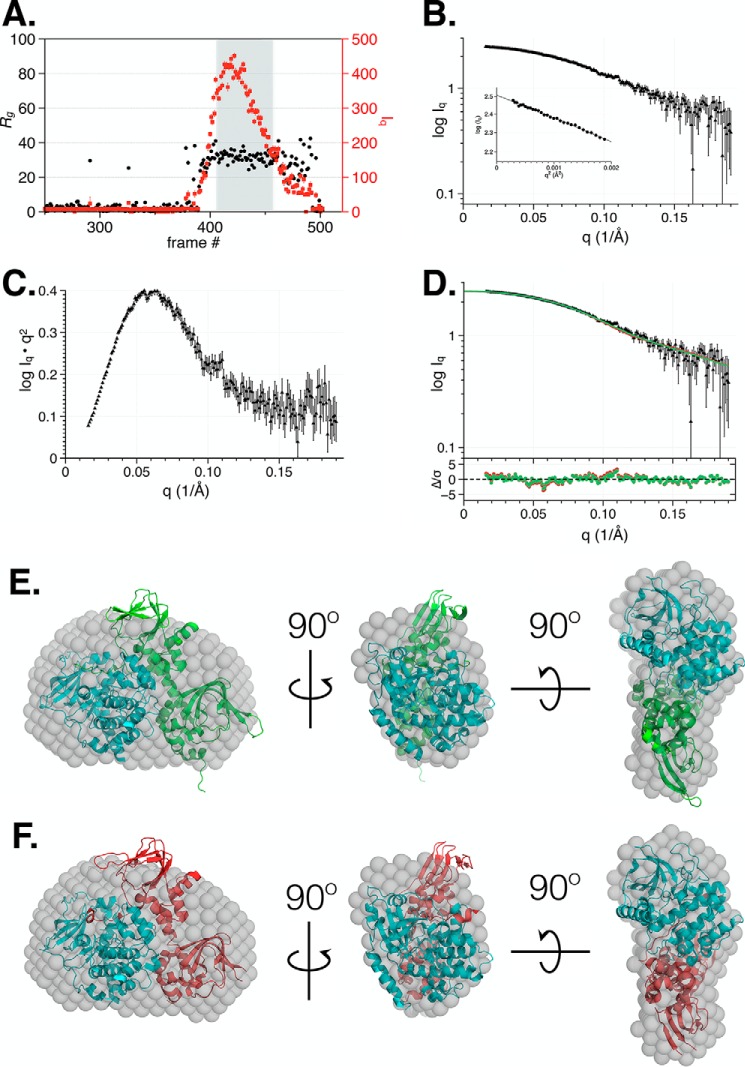
Figure 3.
SEC-SAXS analysis of PKG Iα Δ53 in the autoinhibited state. A, SEC-SAXS trace of Δ53 depicting scattering intensity (red circles; right axis) and Rg values (black circles; left axis) estimated from Guinier plots of each detector exposure frame. B, the intensity profile (Iq versus q) and Guinier plot (inset) for Δ53 was derived from the averaging of frames 410–459 from A. C, Kratky plot of the scattering profile of Δ53 determined using the averaged scattering data from B. D, the resulting fit and residual plot of the intensity profile (Iq versus q) for Δ53 by CRYSOL (allowing constant subtraction) for RIα–C (Protein Data Bank code 2QCS; green) and RIIβ–C (Protein Data Bank code 4WBB; red). The 3D envelope of the scattering curve derived from Δ53 (gray balls) was fit to the crystal structures of RIα–C (NSD = 1.06) (E) and RIIβ–C (NSD = 1.09) (F) heterodimers.

