Figure 6.

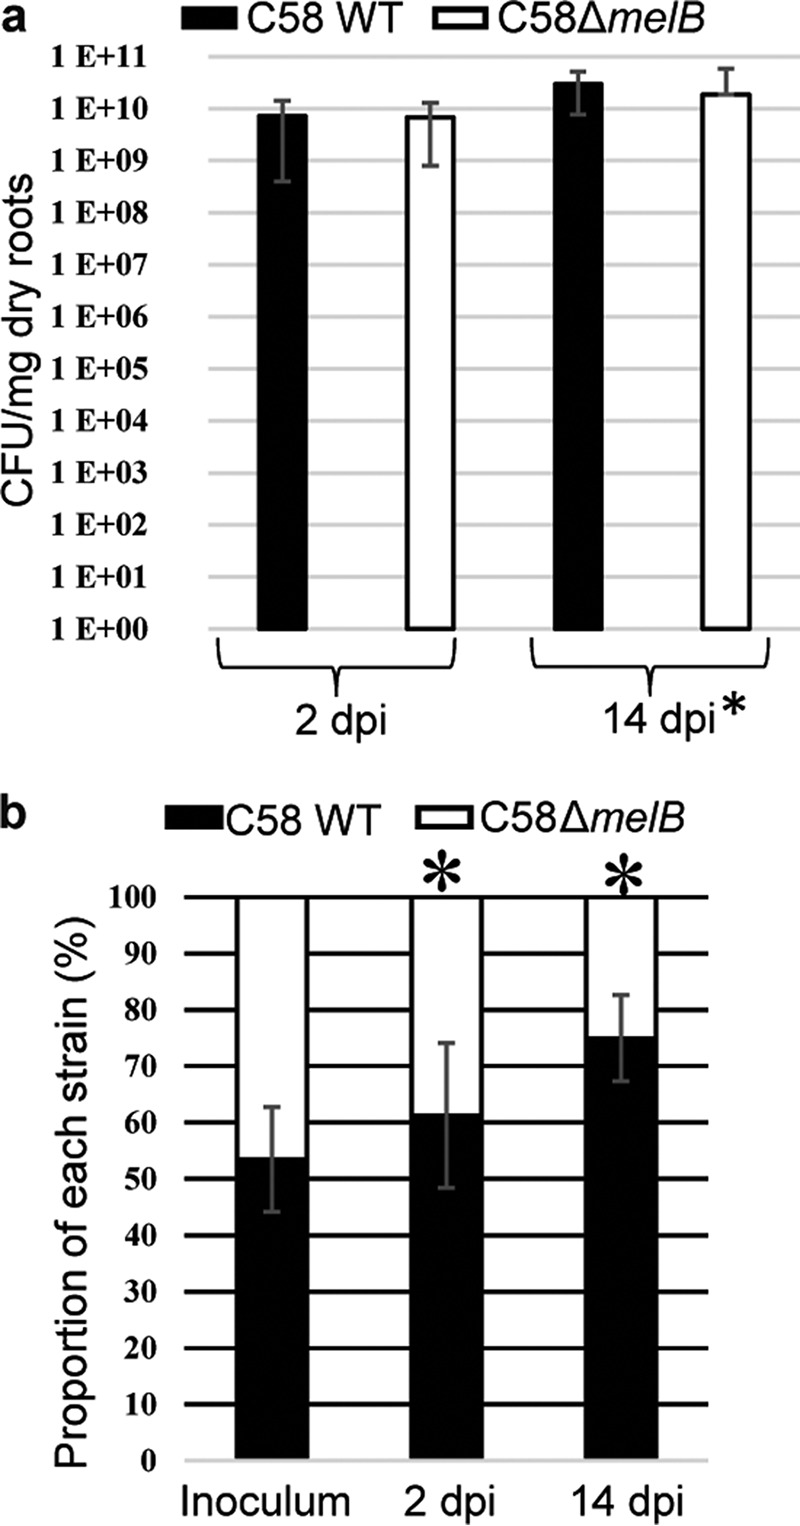
MelB confers a competitive advantage in tomato roots. a, A. fabrum bacterial concentration (cfu/mg dry roots) in tomato roots (at 2 and 14 dpi) infected with either A. fabrum C58 WT or C58ΔmelB mutant. Standard deviations were calculated from three technical and five biological replicates. b, proportion of A. fabrum genotypes (%) in inoculum and tomato root at 2 and 14 dpi infected with a mixture (1:1 ratio) of A. fabrum C58 WT and C58ΔmelB mutant. Standard deviations were calculated from 4 biological replicates and 10 independent assays. Asterisks indicate significant differences (Mann-Whitney test).
