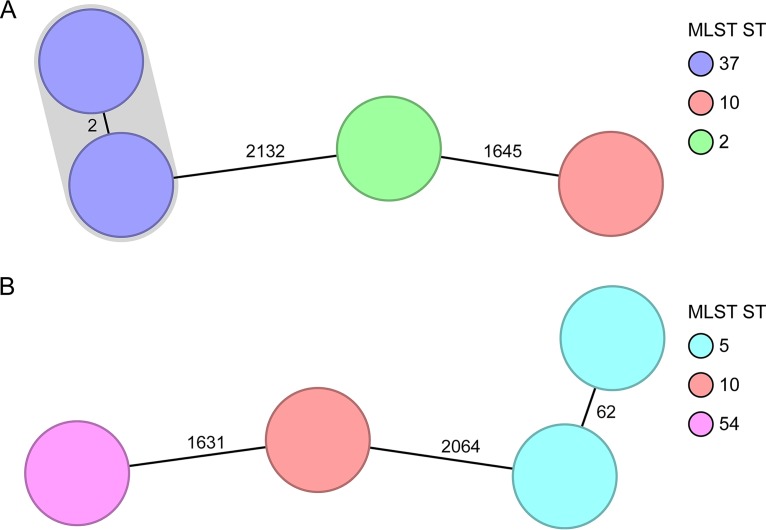
FIG 2.
Minimum-spanning tree of two spatiotemporal clusters (9). Each node represents a unique cgMLST allele profile. The numbers on connecting lines display the number of differing alleles between the genotypes (line length not to scale). The different nodes are colored by the MLST ST, and closely related genotypes (≤6 different cgMLST alleles) are shaded. (A) Short-term cluster of four cases, where one transmission event was epidemiologically confirmed (2,244 to 2,265 cgMLST target genes [mean, 99.5%] were analyzed). (B) Short-term cluster of four cases, where a clonal transmission was ruled out (2,237 to 2,265 cgMLST target genes [mean, 99.1%] were analyzed).

