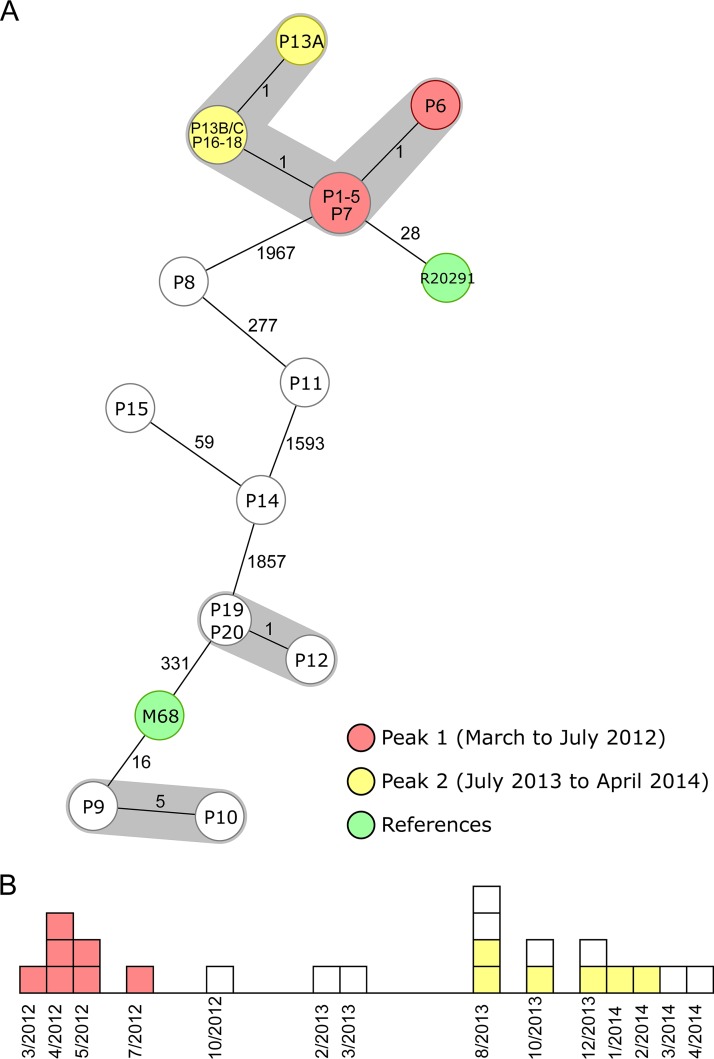
FIG 3.
Minimum-spanning tree and epidemiological curve illustrating a long-term spatiotemporal C. difficile cluster with two identified peaks (15). The 22 cluster isolates are colored according to their peaks, and the two reference strains are marked in green. (A) Minimum-spanning tree of the reanalyzed sequences based on cgMLST targets. Each node represents a unique allelic profile, and the size of the nodes represents the number of isolates. The numbers on connecting lines are the numbers of differing alleles between the genotypes (not to scale), and closely related genotypes (≤6 different cgMLST alleles) are shaded; 2,243 to 2,267 cgMLST target genes (mean of 99.6% of all cgMLST targets) were analyzed. All isolates of peaks 1 and 2 belonged to ST1. (B) Epidemiological curve. Each box represents one isolate, and boxes are colored according to their peak affiliation.

