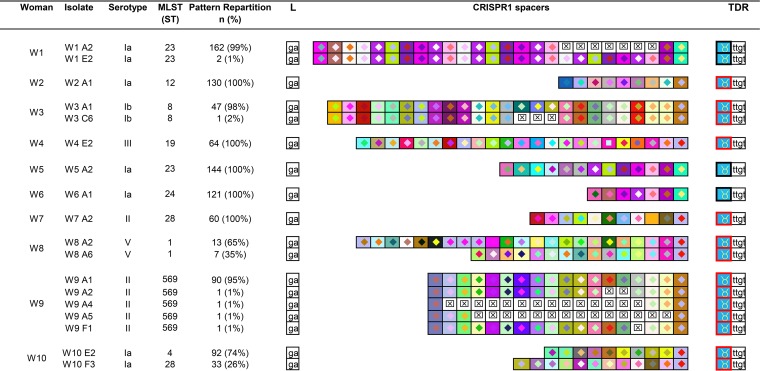
FIG 1.
Spacer composition of CRISPR1 arrays for GBS isolates from 10 women. Only one array is represented by different patterns observed after RFLP. The CRISPR1 arrays are represented using a macro-enabled Excel tool whereby spacers are converted into two-color symbols based on the spacer sequence. Gaps (indicating missing spacers) are shown with a boxed “×” symbol after alignment of identical spacers between strains of the same group. Terminal direct repeats (TDRs) are represented by different color borders according to their sequence. The leader sequence (L) is represented by its last two nucleotides. For each woman, the main CRISPR array was represented first. Each woman presented a specific CRISPR array. Three of the 10 women carried isolates belonging to a single CRISPR type with internal modification of the CRISPR1 array (women 1, 3, and 9). Two of the 10 women carried isolates with different CRISPR1 arrays, indicating the presence of two clones (women 8 and 10).

