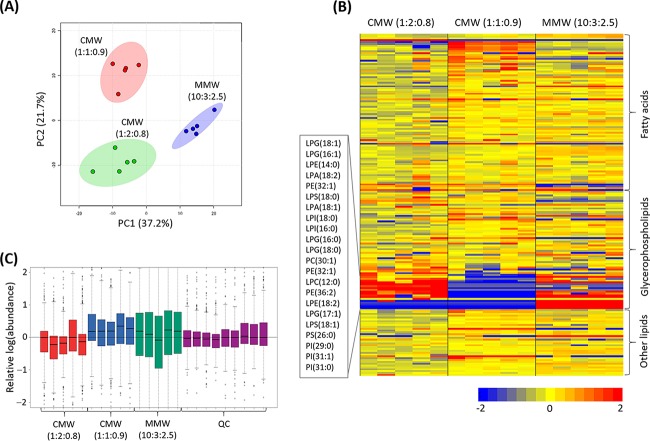
FIG 2.
Method comparison in the extraction of lipidomes from P. aeruginosa strain K (PAK). (A) PCA score plot shows that metabolites are grouped due to different extraction methods: red, CHCl3/MeOH/H2O ([CMW] 1:1:0.9 [vol/vol], double-phase Bligh-Dyer); green, CMW (1:2:0.8 [vol/vol], single-phase Bligh-Dyer); and blue, MTBE/MeOH/H2O ([MMW] 10:3:2.5 [vol/vol], MTBE extraction). The colored dots on the PCA score plot represent five biological replicates. (B) The heat map illustrates the relative peak intensities of lipids with three major lipid classes extracted by three different solvents, CMW (left, 1:2:0.8 [vol/vol]), CMW (middle, 1:1:0.9 [vol/vol]), and MMW (right, 10:3:2.5 [vol/vol]). Five independent biological replicates of each extraction method are shown. Colors indicate relative abundance of lipids in each sample based on the relative peak intensity for each lipid: red, high; yellow, mean; blue, low or undetectable. (C) The bar charts show the relative abundance (log scale) of each sample between different extraction methods as well as the quality control (QC) samples. Box plots show the upper and lower quartiles (tops and bottoms of boxes), medians (lines within the boxes), and the spread of data that are not outliers (whiskers).

